


Sarcopenia is one of the common complications in maintenance hemodialysis (MHD) patients and is associated with poor prognosis. We aimed to study the validity and reliability of ultrasound in the assessment of sarcopenia in MHD patients.
MethodsMHD patients were categorized into the sarcopenia group and the non-sarcopenia group according to the diagnostic criteria of the Asian Working Group on Sarcopenia (AWGS) 2019. Ultrasonography of the left medial head of the gastrocnemius muscle was performed in MHD and healthy controls to obtain muscle thickness (MT), pinnation angle (PA), fascicle length (FL), cross-sectional area (CSA), echo intensity (EI), elastic modulus (E), shear wave velocity (SWV), and microvascular velocity (MV). Compare the differences in ultrasound parameters among different groups, and determine the cut-off values suitable for diagnosing sarcopenia in MHD patients.
ResultsThe MT, CSA, PA, and MV in the sarcopenia group were lower than those in the non-sarcopenia group and the control group; while the EI was higher, the FL of the sarcopenia group was lower than that of the non-sarcopenia group, while the E and SWV of the sarcopenia group were higher than those of the control group. Receiver operating characteristic curve analyses indicated that ultrasound combined index had a good diagnostic value, model Y = 13.511−0.121*MT-0.609*CSA-0.172*PA+0.011*EI-2.205*MV(P < 0.05), with a cut-off value of 0.69.
ConclusionsMulti-modal ultrasound is a safe, non-invasive, and real-time imaging examination method, and can provide information on muscle structure, stiffness, and perfusion, which is expected to be a promising potential tool for predicting sarcopenia in MHD patients.
la atrofia muscular es una de las complicaciones comunes en pacientes con hemodiálisis de mantenimiento (HDM) y tiene un mal pronóstico. Nuestro objetivo es estudiar la eficacia y fiabilidad de la ecografía en la evaluación de la sarcopenia en pacientes con HDM.
Métodolos pacientes con HDM se dividieron en los grupos de sarcopenia y sin sarcopenia, de acuerdo con los criterios diagnósticos del Grupo de Trabajo de Asia sobre Sarcopenia (GTAS) 2019. Se realizó una ecografía de la cabeza medial izquierda del músculo gastrocnemio en pacientes con HDM y un grupo de control saludable para obtener los parámetros de: grosor muscular (GM), ángulo de pluma (AP), longitud del haz (LH), área transversal (AT), intensidad de eco (IE), módulo de elasticidad (ME), velocidad de onda de corte (VOC) y velocidad microvascular (VM). Se compararon las diferencias en los parámetros de ultrasonido entre los diferentes grupos y se determinó el valor crítico adecuado para el diagnóstico de sarcopenia en pacientes con HDM.
Resultadoslos niveles de GM, AT, AP y VM en el grupo con sarcopenia fueron menores que en el grupo sin sarcopenia y el grupo de control; mientras que la IE fue mayor, la LH en el grupo con sarcopenia fue menor que en el grupo sin sarcopenia, y el ME y la VOC en el grupo con sarcopenia fueron mayores que en el grupo control. El análisis de la curva característica de trabajo del sujeto mostró que el índice combinado de ultrasonido tenía un buen valor diagnóstico, con el modelo Y = 13,511−0,121*GM-0,609*AT-0,172*AP+0,011*IE-2,205*VM(P < 0,05)), con un valor de corte de 0,69.
Conclusiónla ecografía multimodal es un método de examen por imágenes seguro, no invasivo e instantáneo que puede proporcionar información sobre la estructura, rigidez y perfusión muscular, y se espera que se convierta en una herramienta con potencial y prometedora para predecir la sarcopenia en pacientes con HDM.
Sarcopenia is a progressive age-related systemic skeletal muscle disease that includes generalized loss of muscle mass and strength and decreased physical performance.1 MHD is the most common replacement therapy for end-stage renal disease(ESRD), and adverse factors such as nutrient loss or inadequate uptake during prolonged dialysis, hormonal imbalances, electrolyte disturbances, and chronic inflammation can accelerate the process of protein-energy depletion, leading to increased muscle and fat loss and a high risk of sarcopenia.2,3 The prevalence of sarcopenia in MHD patients varies due to differences in race, sample size, and diagnostic criteria for sarcopenia. Sarcopenia significantly increases the occurrence of adverse events, including falls, fractures, cardiovascular events and all-cause mortality.4,5 Therefore, early identification of patients at risk for sarcopenia and provision of interventions are of great clinical significance, which are important to prolong the life of dialysis patients and improve their quality of life.
The measurement of muscle mass in the diagnosis of sarcopenia is an important step. Bio-electrical impedance analysis (BIA), dual-energy X-ray absorptiometry (DXA), CT, MRI and ultrasound are clinically available to estimate muscle mass.6 However, the accuracy of BIA and DXA may be influenced by the patient's hydration status and adiposity.7,8 MRI is more expensive and has some limitations, such as contraindications to metal implants and lack of diagnostic criteria. CT is considered to be the measurement of the gold standard method for measuring muscle mass, but it is not suitable for widespread screening for sarcopenia due to radiation exposure and high cost.9,10 Therefore, it is particularly important to find a validated and suitable assessment tool for clinical use. Ultrasound, as a noninvasive imaging method, can be used to assess muscle structure, stiffness, and microvascular perfusion by two-dimensional grey-scale ultrasound, elastography, and superb microvascular imaging, which has the advantages of real-time, convenient, and easy bedside operation. The use of ultrasound to measure muscle thickness、cross-sectional area、pinnation angle and fascicle length to estimate muscle mass has been reported.11,12 At present, ultrasound is rarely applied in patients with MHD sarcopenia disease. Therefore, this study explored the value of multimodal ultrasound in diagnosing sarcopenia in patients with MHD to identify patients at risk for sarcopenia early and improve their prognosis and quality of life.
Materials and methodsParticipants52 patients receiving MHD in the outpatient clinic at the Department of Nephrology of the Second Affiliated Hospital of Chongqing Medical University from March 2022 to October 2022 were selected as the study population. The inclusion criteria were: ① regular hemodialysis time ≥3 months; ② age ≥18 years, knowledge of the study and voluntary participation. The exclusion criteria were: ① pregnancy, patients with mental illness, patients with cognitive impairment; ② inability to tolerate BIA or grip strength or gait speed tests due to physical reasons; ③ wasting diseases such as malignancy, tuberculosis, liver disease, peptic ulcer; ④ previous parathyroidectomy; ⑤ previous acute infection or cardiovascular accident within 6 months; ⑥ native muscle-related diseases, such as myasthenia gravis. Randomly selected 24 healthy examinees as the control group; and the rejection criteria was: unsatisfactory image acquisition. A total of 46 MHD patients and 23 healthy examinees were included according to the inclusion, exclusion and rejection criteria. The Second Affiliated Hospital of Chongqing Medical University institutional review board approved this study (No. 2023-9). All patients signed an informed consent form.
Muscle strengthHandgrip strength was tested using an electronic handgrip strength meter (CAMRY EH101, China). The patient is placed in a standing position, with both upper limbs naturally sagging on their sides. Both hands are measured twice, with an interval of 3 min between each measurement, and the maximum value is taken.
Meter walking testA 6-meter walking speed assessment was selected. The patients walked 6 m straight ahead at normal speed without any tool assistance and slowing down, recorded the required time, and repeated the measurements after 3 min of rest, and took the average of the two measurements.
Muscle mass estimationA bioelectrical impedance analyser (InBody s10, China) was used to measure body composition when dialysis was completed. The measurements included body mass index (BMI), and skeletal muscle mass (SMM) (appendicular skeletal muscle mass index, ASMI) (kg/m2) = SMM (kg)/height squared (m2).
Diagnostic criteria for malnutritionMHD patients were evaluated for their nutritional status using the Patient-Generated Subjective Global Assessment (PG-SGA). A final score of ≤ 1 indicates good nutritional status, while a score of >1 indicates that the patient may have malnutrition.
Ultrasound parameter measurementThe Aixpiorer color ultrasound Doppler(France)was used to measure the muscle structure parameters of the left medial head of gastrocnemius, and the SL-15 probe was selected at a frequency of 15 MHz. The patients were placed in a prone position on the scanning bed and were asked to relax for 10 min with the left lower limbs exposed keeping the left foot naturally down and the left ankle in a neutral position. The probe was placed on top of the skin with a minimal load ensuring no external pressure could affect the tests. The musculoskeletal-two-dimensional panoramic mode was selected, and the transverse view of the left medial head of gastrocnemius was obtained in the upper middle 1/3 of the line from the medial tibial condyle to the highest point of the medial malleolus. The structures of the muscle were clearly displayed and the CSA was measured. The two-dimensional cross-sectional images were imported into Adobe Photoshop 20 and the EI was measured; Then the probe was rotated 90 degrees to obtain the longitudinal image in the same position, and the muscle's MT, PA, and FL was measured ; In microflow imaging mode, select the velocity scale as 2 cm/s, MV was measured using PW; In SWE mode, the region of interest (ROI) size was set at mm. Q-Box was set to 5 × 5 mm, and SWV and E were measured at a distance of 1.0–1.5 cm from the skin. All subjects were acquired by the same ultrasonographer. The above acquisitions were measured 3 times consecutively and the average value was taken.
Diagnostic criteria for sarcopeniaThe diagnosis of sarcopenia was based on the Asian Working Group for Sarcopenia (AWGS) criteria, the cut-off values are as follows: ① low muscle mass: ASMI measured by BIA < 7.0 kg/m2 in males and < 5.7 kg/m2 in females; ② low muscle strength was defined as handgrip strength < 28 kg in males and < 18 kg in females; ③ Physical mobility: low gait speed cut-off value was < 1.0 m/s. In this study, those who met ① and ② with or without ③ will be enrolled in the sarcopenia group.
Statistical analysesStatistical analyses were performed using SPSS 26.0 software (SPSS Inc., IBM Corporation, Armonk, NY, USA). Categorical variables were expressed as counts and percentages (n, %), and were compared using the Chi-squared test between groups. The Kolmogorov Smirnov test was used to test the normality of measurement data, normally distributed variables were expressed as mean ± SD and Non-normally distributed variables were expressed as P50. Multiple groups were compared by one-way ANOVA. Binary logistic regression analysis was performed to determine the factors influencing sarcopenia in MHD. Pearson correlation coefficient analysis was used to compare the relationship between ultrasound parameters and clinical data. Receiver operating characteristic (ROC) curves and the area under the curve were used to evaluate the diagnostic value ultrasound for sarcopenia. The best cut-off value was calculated using the Youden index. P < 0.05 was considered statistically significant.
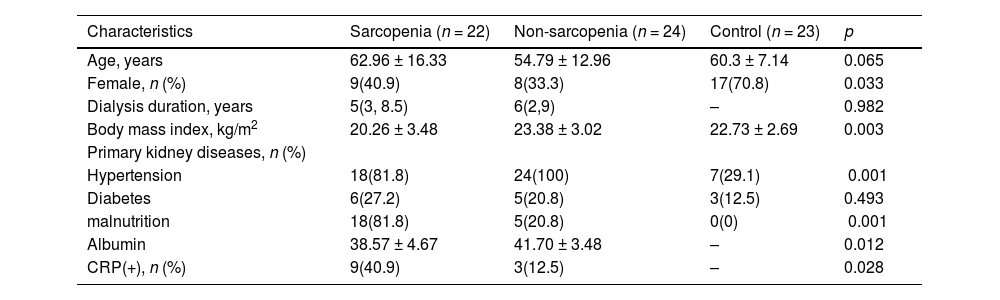
ResultsGeneral informationA total of 46 MHD patients and 23 age-matched healthy controls were included in this study. Among the 46 MHD patients, 22 (47.83%) were included in the sarcopenia group and 24 (52.17%) were included in the non-sarcopenia group. By comparing the general conditions of the three groups of patients, there were statistically significant differences in gender, BMI, hypertension,malnutrition status, albumin and CRP(p < 0.05), but there were no statistical differences in age and diabetes (Table 1).
Comparison of general information between sarcopenia, non-sarcopenia, and control groups.
| Characteristics | Sarcopenia (n = 22) | Non-sarcopenia (n = 24) | Control (n = 23) | p |
|---|---|---|---|---|
| Age, years | 62.96 ± 16.33 | 54.79 ± 12.96 | 60.3 ± 7.14 | 0.065 |
| Female, n (%) | 9(40.9) | 8(33.3) | 17(70.8) | 0.033 |
| Dialysis duration, years | 5(3, 8.5) | 6(2,9) | – | 0.982 |
| Body mass index, kg/m2 | 20.26 ± 3.48 | 23.38 ± 3.02 | 22.73 ± 2.69 | 0.003 |
| Primary kidney diseases, n (%) | ||||
| Hypertension | 18(81.8) | 24(100) | 7(29.1) | <0.001 |
| Diabetes | 6(27.2) | 5(20.8) | 3(12.5) | 0.493 |
| malnutrition | 18(81.8) | 5(20.8) | 0(0) | <0.001 |
| Albumin | 38.57 ± 4.67 | 41.70 ± 3.48 | – | 0.012 |
| CRP(+), n (%) | 9(40.9) | 3(12.5) | – | 0.028 |
Note:CRP(+):CRP≥10 mg/L.
Sarcopenia was associated with multiple factors, and indicators that were significant in the univariate regression analysis (P < 0.05) were included in the binary logistic regression analysis. The results showed that malnutrition status (OR = 0.028, 95% CI: 0.005−0.139, P < 0.001) and BMI (OR = 0.713, 95% CI: 0.550−0.925, P < 0.05) were associated with sarcopenia in MHD patients (Table 2).
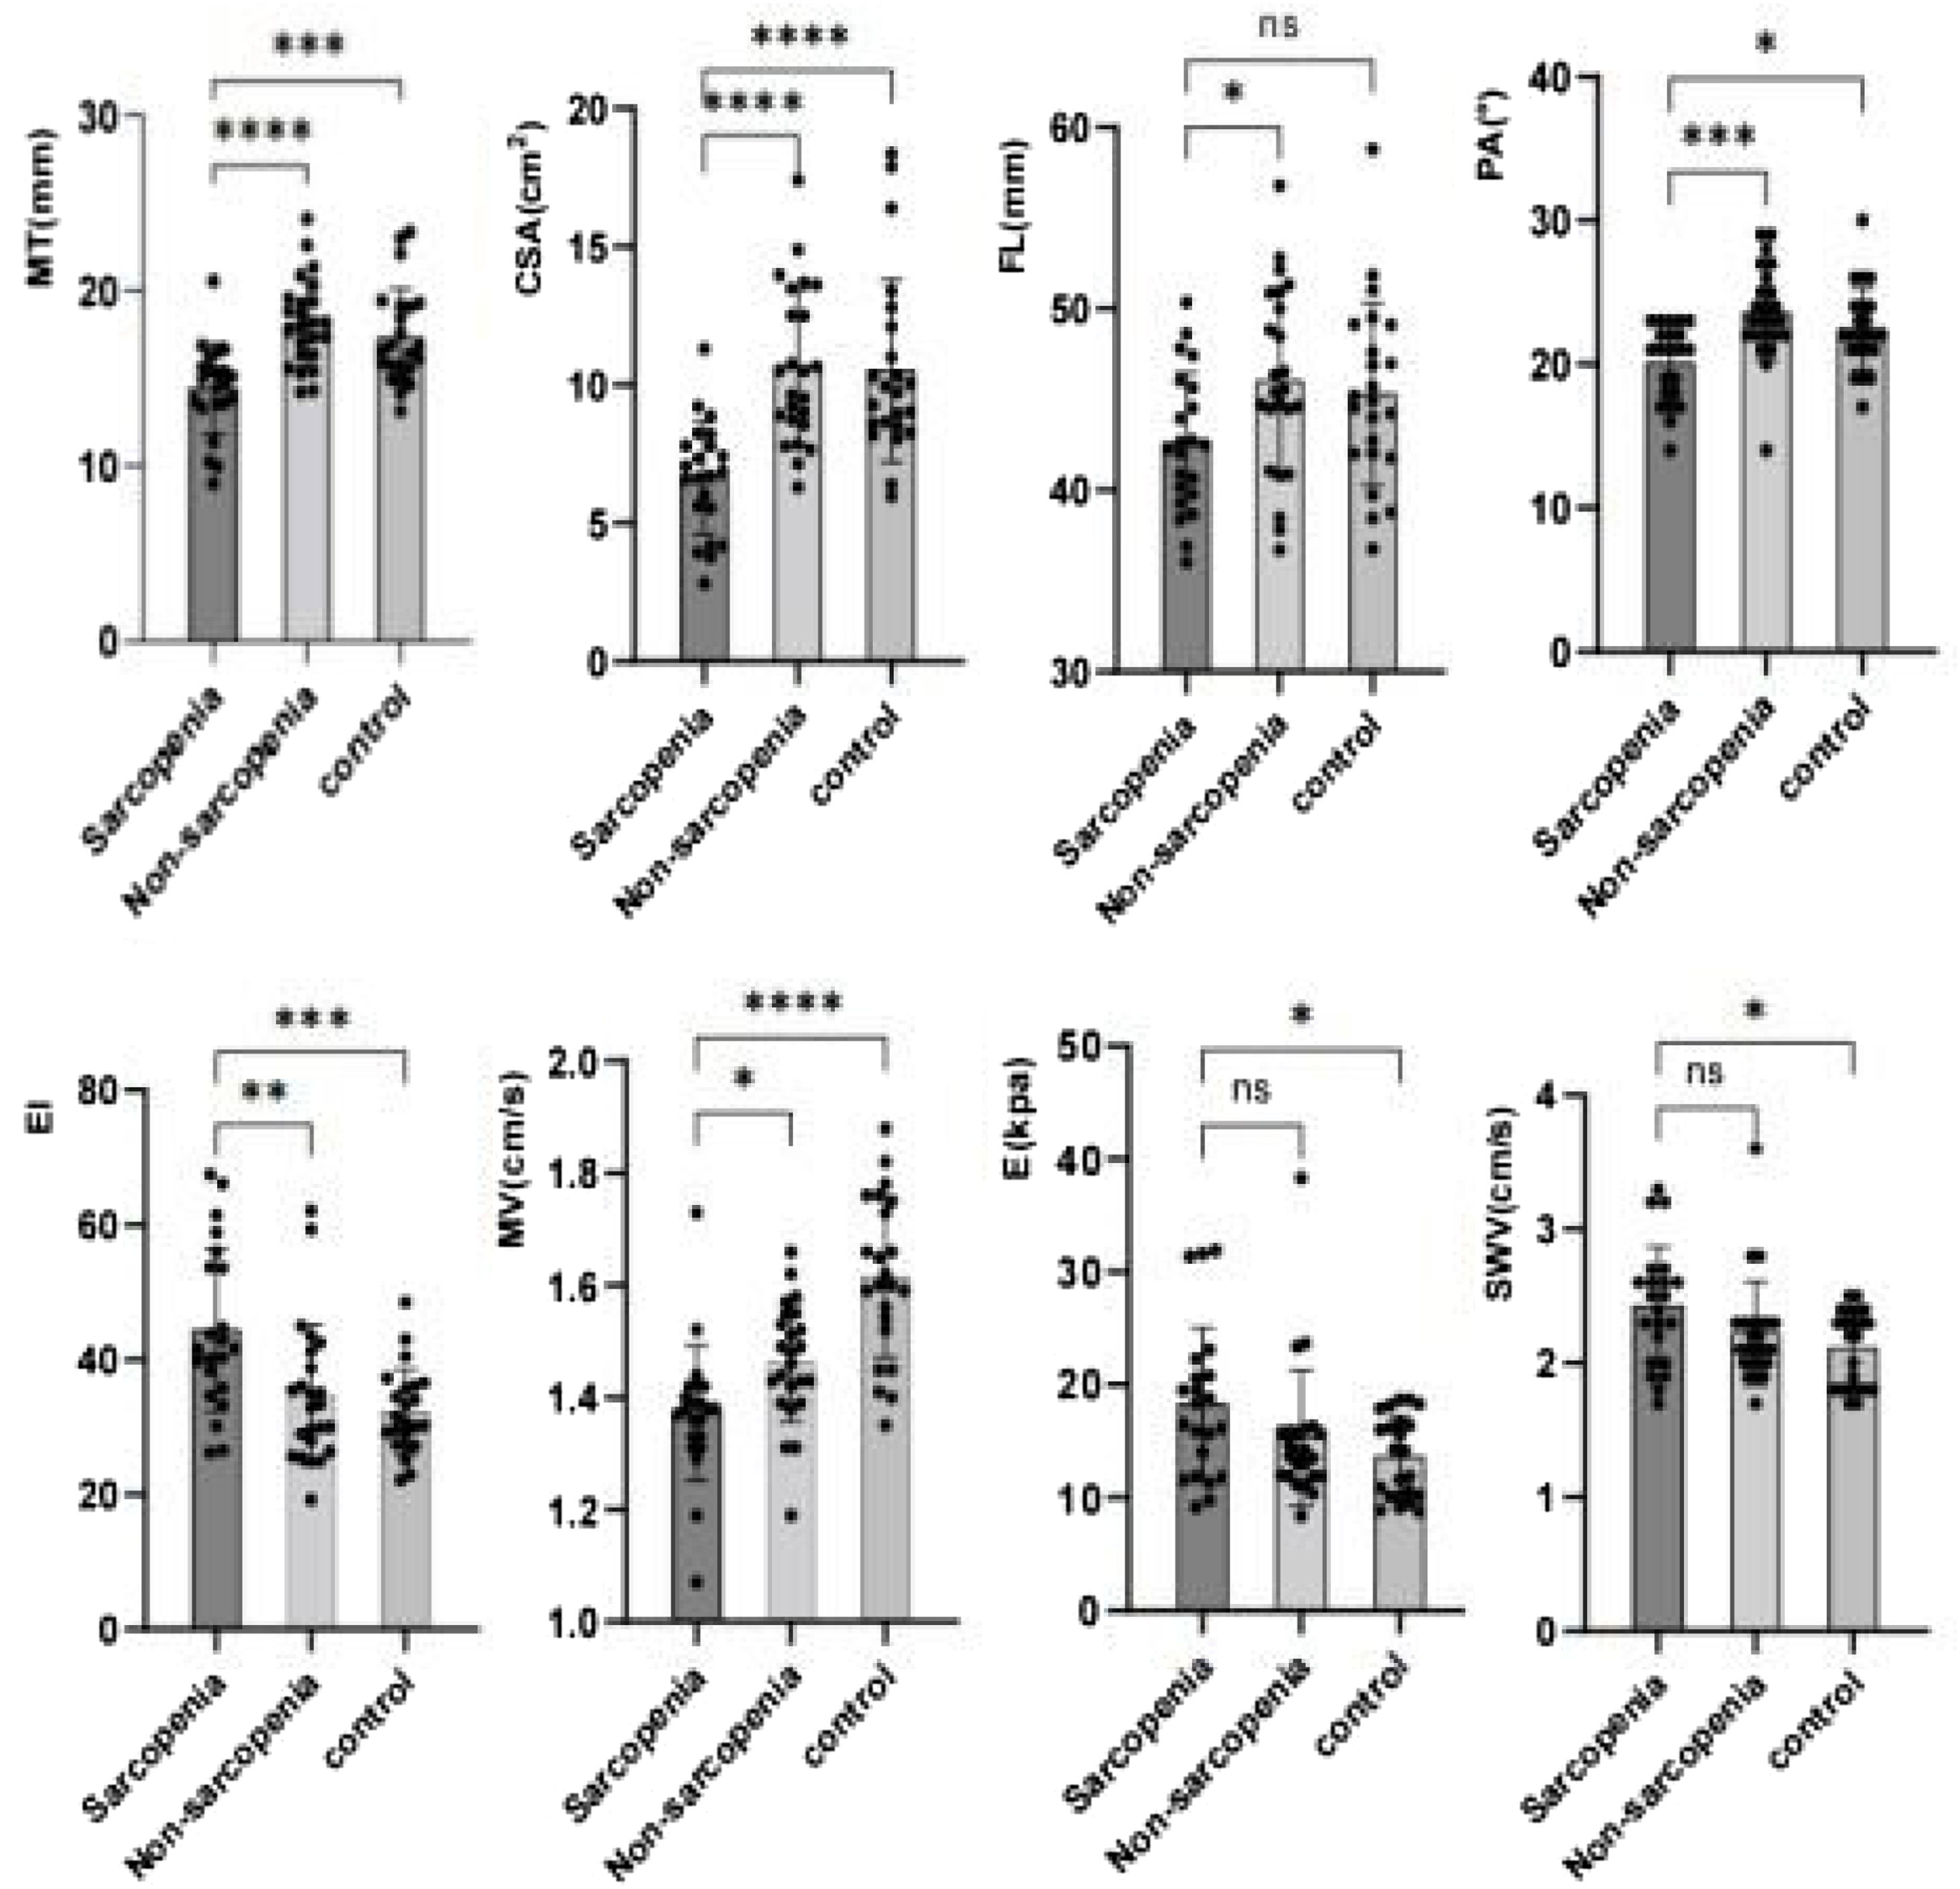
Ultrasound parameterThe structural parameters of the left gastrocnemius muscle medial head muscle measured by ultrasound in the relaxed state of each group are shown in Fig. 1. Compared with the non-sarcopenia group, the MT, CSA, FL, PA, and MV of the sarcopenia group were lower than those of the non-sarcopenia group, while the EI was higher than that of the non-sarcopenia group. There was no statistically significant difference in E and SWV; Compared with the control group, the MT, CSA, PA and MV of the sarcopenia group were lower than those of the control group, while the EI, E, and SWV were higher than those of the control group, the differences in FL was not statistically significant; Compared with the control group, the MV of the non-sarcopenia group was smaller than that of the control group, and there was no significant statistical difference in other muscle structural parameters between the two groups.

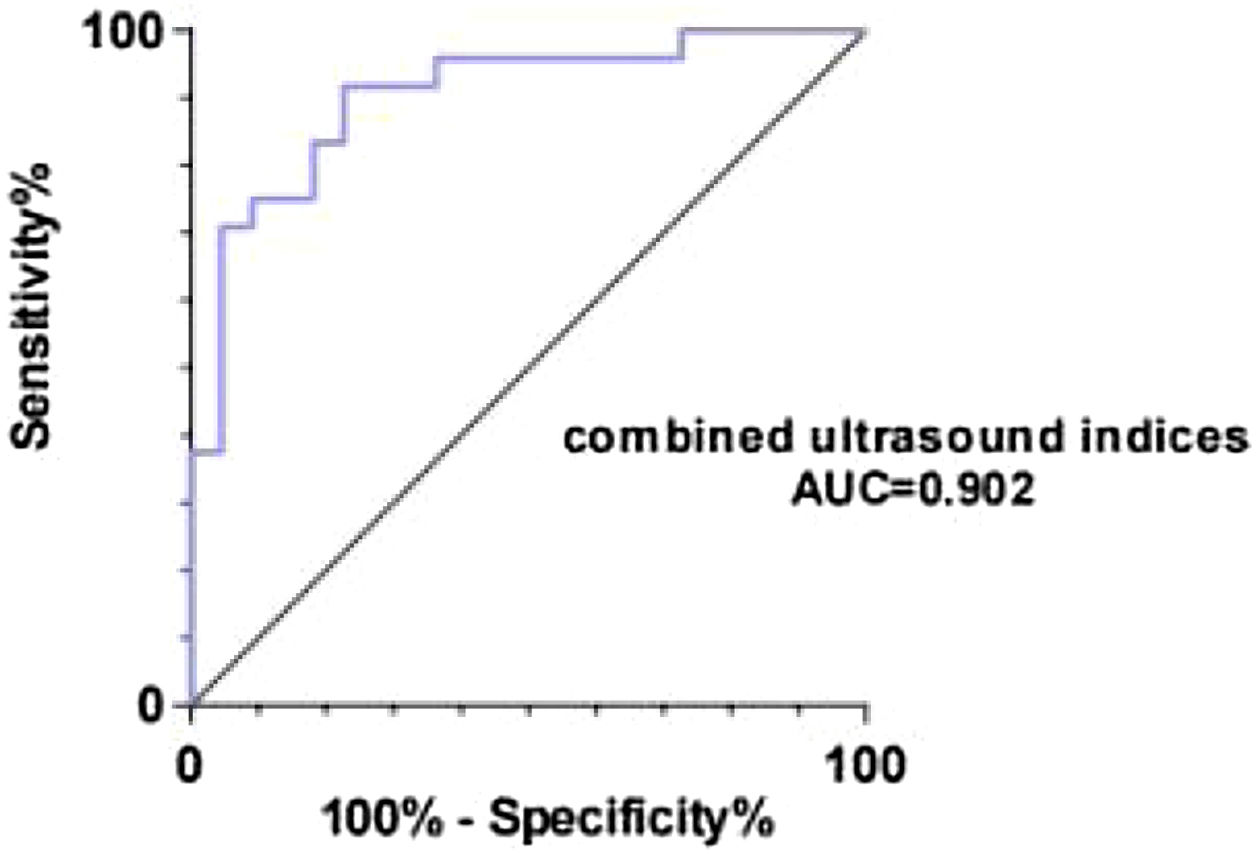
The above results indicate that MT, CSA, PA, EI and MV were correlated with sarcopenia, we used the ROC curve to explore whether variables could act as diagnostic markers to identify sarcopenia in MHD patients. According to the ROC curve analysis, the area under the curve for the combined ultrasound indices is 0.902, which is larger than any independent variable (Fig. 2). The best cut-off value of the combined ultrasound indices for the diagnosis of sarcopenia was 0.69 with a sensitivity of 77.3% and specificity of 91.7%, model Y = 13.511−0.121*MT-0.609*CSA-0.172*PA + 0.011*EI-2.205*MV(P < 0.05).

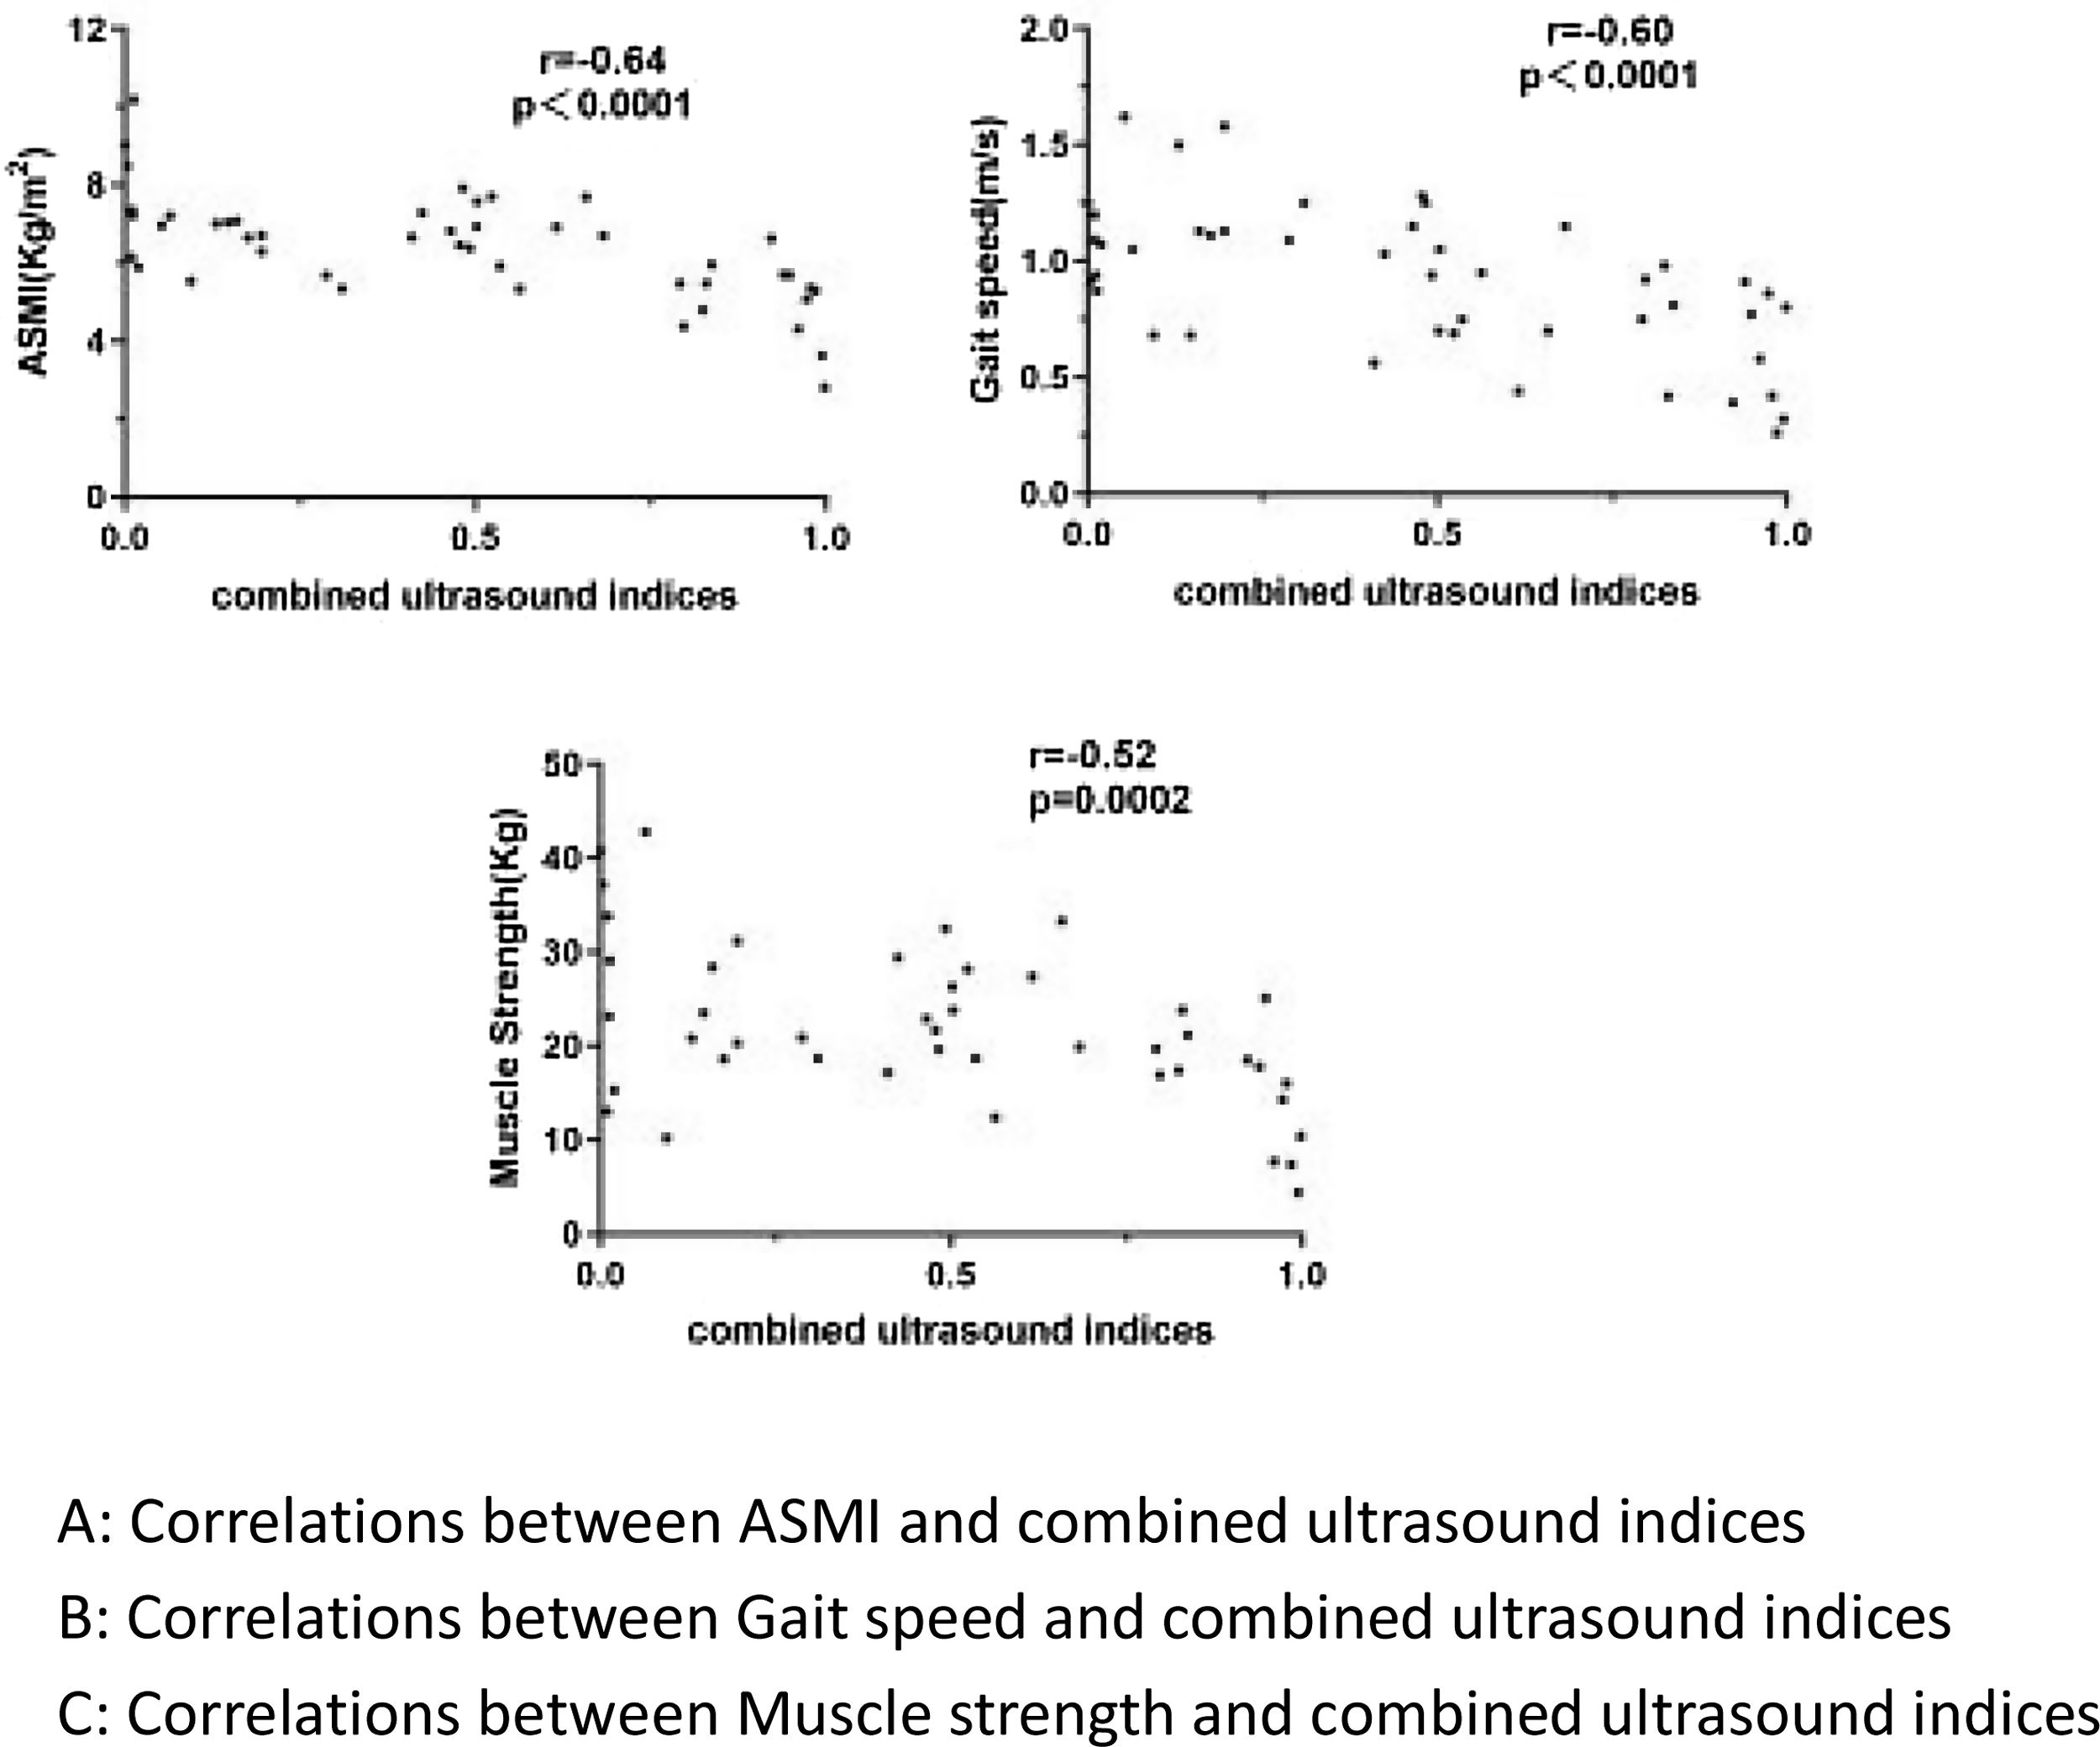
As shown in Fig. 3, there is a certain correlation between ultrasound-combined indicators and clinical diagnostic parameters of sarcopenia, with a moderate negative correlation between ASMI, grip strength, and gait speed (P < 0.001). In order to exclude the influence of factors related to sarcopenia on the measurement results, we adjusted for BMI and nutritional status, and the results showed that the combined ultrasound indicators still had a certain correlation with ASMI, grip strength, and gait speed.

Correlation analysis between combined ultrasound indices and clinical diagnostic parameters of sarcopenia.
A: Correlations between ASMI and combined ultrasound indices.
B: Correlations between Gait speed and combined ultrasound indices.
C: Correlations between Muscle strength and combined ultrasound indices.
With the improvement of living standard and the trend of population ageing, the incidence of chronic kidney disease is increasing annually. According to statistics, the prevalence of chronic kidney disease in China is 8.2%, of which patients with CKD stage 4–5 account for about 1.8%.13 Maintenance hemodialysis therapy is an important treatment and it improves the survival rate of patients with end-stage chronic kidney disease. Unfortunately, maintenance hemodialysis treatment is also associated with a series of complications, such as sarcopenia. A study based on the prevalence of sarcopenia in MHD patients in China showed that the prevalence of sarcopenia in MHD patients was about 13.7%, and the incidence rate of sarcopenia in MHD patients over 60 years old is as high as 33.3%.14 There is increasing evidence to show that sarcopenia is associated with increased rehospitalization and mortality in patients with MHD. Currently, high-frequency ultrasound can clearly demonstrate muscle structure due to the different acoustic impedances of muscles, tendons, and other connective tissues. With the development of shear wave elastography and ultra-microblem imaging, ultrasound can also assess muscle stiffness and microbeam perfusion, allowing for a more comprehensive assessment of muscle mass. Studies have shown that ultrasound is in good agreement with the "gold standard" MRI in the assessment of muscle mass.15 Although some studies have shown that ultrasound can be used for the diagnosis of sarcopenia,16 there is limited evidence of its diagnostic ability in MHD patients with sarcopenia.
The reduction in muscle mass induced by maintenance hemodialysis is heterogeneous and is more pronounced in the weight-bearing muscles of the lower extremities, such as the quadriceps and gastrocnemius. The gastrocnemius, as a single-pinned muscle with a parallel arrangement of muscle fibres, is the ideal site for assessing the pinna angle, fascicle length and muscle thickness.17,18 Previous studies have found that muscle thickness, muscle cross-sectional area, and muscle stiffness are good predictors of sarcopenia in the elderly, but the relationship between ultrasound indices and sarcopenia in MHD patients is unclear. In this study, we evaluated the medial head of the left gastrocnemius muscle and compared it with commonly used anthropometric parameters to predict sarcopenia in MHD patients. The results of Wang et al. suggested that MT measured by ultrasound can be directly considered as a factor of low muscle mass.19 Kuyumcu et al. showed that the cut-off value for the thickness of the medial head muscle of the gastrocnemius was 16.9 mm for the diagnosis of sarcopenia.20 Our study indicated that a critical value of 16.95 mm for the thickness of the medial head muscle of the left gastrocnemius could be used to diagnose sarcopenia in patients with MHD with a sensitivity of 95.5%. Several studies have shown that ultrasound-measured skeletal muscle cross-sectional area has a significantly high correlation with CT and MRI.21 Our findings indicated that the area under the curve predicted by CSA for sarcopenia is 0.887, which is one of the better predictive indicators for sarcopenia in MHD patients and has a moderate correlation with clinical sarcopenia diagnostic parameters (ASMI, grip strength and gait speed, r = 0.718, 0.533, 0.444). Some researchers have suggested that PA and FL measurements are promising and potentially effective techniques for predicting sarcopenia.1,22 However, Kuyumcu M E et al. showed that the PA was not significantly associated with reduced muscle mass, because the measurement of PA and FL is greatly affected by the patient's position, and slight muscle contraction can significantly alter the size of PA and FL, resulting in unstable measurements.20 In our research, there was no significant difference in FL between the sarcopenia group and the control group; although there were some differences in PA among the three groups, the sensitivity and specificity of the diagnosis were not high. The inconsistency of results in different studies may be related to the stability of these two indicators measurement. Therefore, the value of using PA and FL alone to diagnose sarcopenia in patients with MHD research needs further research. Patients with MHD are in a chronic microinflammatory state, and the long-term inflammatory state can directly affect the blood flow perfusion in skeletal muscle. Ultra-microfluidic imaging techniques can clearly display microscopic low-velocity blood flow with high resolution. This technique is commonly used for liver and breast diseases. A systematic review study confirmed its value in musculoskeletal diseases.23 However, Ultramicroscopic flow imaging techniques have rarely been used in sarcopenia patients with MHD. The results of Hernández-Socorro C R showed that micro-angiogenic activity was significantly lower in patients with muscle weakness or low muscle mass than in healthy subjects.24 Although the present study did not compare muscle microangiogenic activity between the sarcopenia group and the non-sarcopenia group, we found that microvascular blood flow velocities were significantly lower in patients with sarcopenia than in those without sarcopenia. This may be due to the microvascular damage and blood stagnation caused by prolonged inflammation in patients with MHD, our research results also indicate that CRP levels were significantly elevated in patients with sarcopenia. MV is not affected by the patient's height and weight and has a certain correlation with the clinical parameters of ASMI, grip strength, and gait speed, which is expected to be one of the reliable indicators for predicting sarcopenia in MHD patients. A study of muscle stiffness in patients with sarcopenia disease found that muscle stiffness in patients with sarcopenia was lower than that of non-sarcopenia patients in both relaxed state and contracted state, the decrease in resistance and increased flexibility of the elastic fibre system in the extracellular matrix of muscle cells is one of the reasons for the decrease in muscle stiffness in patients with sarcopenia.25,26 In our research, the SWV and E of the sarcopenia group were higher than those of the control group, but there was no significant difference between the SWV and E of the non-sarcopenia group. Our results indicate that the muscle stiffness of the sarcopenia group is higher than that of the control group, which may be due to an increase in skeletal muscle interstitial fibre tissue (especially type I collagen) in sarcopenia patients, which increases muscle stiffness.27 In addition, MHD patients have electrolyte disorders, calcium-phosphorus imbalance, and calcium can heterotopic deposit in the muscle, leading to an increase in muscle stiffness.28 Increasing age not only causes muscle atrophy but also fat infiltration, leading to a decrease in muscle stiffness. This also leads to no statistically significant difference in SWE and E between the sarcopenia group and the non-sarcopenia group. Muscle echogenic intensity is considered to be one of the objective indicators for assessing sarcopenia and can provide the presence of inflammation, fibrosis and fatty infiltration in muscles.29 This study shows that the EI of the sarcopenia group is higher than that of the non-sarcopenia group and the control group. Muscle echo intensity is not affected by body position or operator, and the results are output by specific software. The results are objective and stable and are expected to be one of the reliable indicators for predicting sarcopenia in MHD patients.
The above results indicate that ultrasound has a certain value in the prediction of sarcopenia in patients with MHD. Individual indicators may have limitations in diagnosis due to the influence of different patient body sizes and postures on the measurements. The combined ultrasound indices are not only superior to individual indicators in terms of diagnostic efficacy, but also have a better correlation with clinical diagnostic parameters of sarcopenia (ASMI, grip strength, walking speed), making it more suitable as a predictive indicator for sarcopenia in MHD patients.
Currently, the use of ultrasound in the diagnosis of sarcopenia in patients with MHD is rare, and the existing clinical criteria for the diagnosis of sarcopenia require the measurement of grip strength and gait speed, which cannot be evaluated in patients with upper limb pathology and difficulty in standing and walking. Ultrasound can serve as a safe, non-invasive, simple, and real-time detection method to replace the complex clinical evaluation of sarcopenia.
ConclusionsIn this cross-sectional study, we evaluated the clinical feasibility of ultrasound as a diagnostic tool for MHD patients with sarcopenia. Multimodal ultrasound shows excellent ability to identify patients at higher risk of sarcopenia and has better diagnostic capabilities, providing a convenient, real-time, and objective evaluation method for the diagnosis and follow-up of clinical sarcopenia.
Data sharing statementThe data that support the findings of this study are available from the corresponding author upon reasonable request.
Ethics committee approvalEthical approval was obtained from the Ethics Committee of the Second Affiliated Hospital of Chongqing Medical University.
Conflicts of interestThe authors have no conflict of interest to declare.
FundingThis project was supported by the Natural Science Foundation of Chongqing Municipality (CSTB2022NSCQ-MSX0766) and Chongqing Science and Health Joint Medical Research Project (2024MSXM154).
We would like to express gratitude to all the families involved in this study. At the same time, thank all the participants who gave their time to participate in this study.

