


The prevalence of malnutrition is high among the elderly population. Hospital admission is a window of opportunity for its detection.
ObjectiveTo assess the concordance of different nutritional scales in hospitalized patients.
MethodsProspective study in non-institutionalized patients over 65 years of age admitted to an internal medicine department. Five malnutrition screening surveys (MNA, MST, MUST, NRS-2000 and CONUT) and three nutritional risk screening surveys (SCREEN 3, 8 and 14) were compared. As gold standard we use the Global Malnutrition Leadership Initiative for Malnutrition (GLIM) definition of malnutrition.
ResultsEighty-five patients (37% female, median age 83 years) were included. Forty-eight percent (95% CI 38–59%) of patients were classified as malnourished according to GLIM criteria. The SCREEN 3 scale was the most sensitive (93%; 95% CI 87–98) and MUST the most specific (91%; CI 85–99). The most effective scale for excluding suspected malnutrition was SCREEN 3 (LR− 0.17; 95% CI 0.05−0.53) and the best for confirming it was MST (LR+ 7.08; 95% CI 3.06–16.39). Concordance between the different scales was low or very low with kappa indices between 0.082 and 0.465.
ConclusionsA comprehensive approach is needed to detect malnutrition in hospitalized patients. More sensitive scales are more useful in initial screening. Nutritional risk tools could be effective at this stage. In a second step, malnutrition should be confirmed according to established criteria such as GLIM.
La prevalencia de malnutrición es elevada entre la población mayor. El ingreso hospitalario es una ventana de oportunidad para su detección.
ObjetivoValorar la concordancia de distintas escalas nutricionales en pacientes hospitalizados.
Materiales y métodoEstudio prospectivo en pacientes mayores de 65 años no institucionalizados ingresados en un servicio de Medicina Interna. Se compararon 5 encuestas de cribado de malnutrición (MNA, MST, MUST, NRS-2000 y CONUT) y 3 encuestas de cribado de riesgo nutricional (SCREEN 3, 8 y 14). Como patrón de referencia se utilizó la definición de malnutrición de la Iniciativa Global para el Liderazgo en Malnutrición (GLIM).
ResultadosSe incluyeron 85 pacientes (37% mujeres, mediana de edad 83 años). Un 48% (IC 95% 38–59%) de los pacientes fueron clasificados como malnutridos según criterios GLIM. La escala SCREEN 3 fue la más sensible (93%; IC 95% 87–98) y MUST la más específica (91%; IC 85–99). La escala más eficaz para excluir la sospecha de malnutrición fue SCREEN 3 (LR− 0,17; IC 95% 0,05−0,53) y la mejor para confirmarla fue MST (LR+ 7,08; IC 95% 3,06–16,39). La concordancia entre las distintas escalas fue baja o muy baja con índices kappa entre 0,082 y 0,465.
ConclusionesSe precisa un abordaje integral para detectar la malnutrición en adultos mayores ingresados. Las escalas más sensibles son más útiles en el cribado inicial. Las herramientas de riesgo nutricional podrían ser eficaces en esta etapa. En un segundo paso se debe confirmar la malnutrición de acuerdo con criterios establecidos como los de la GLIM.
Malnutrition is a common condition in the elderly, especially in hospitalized patients.1,2 There are multiple causes that make malnutrition more frequent in this group of patients, above all, those related to intake, either due to the presence of anorexia or hyporexia, or due to the limited variety of foods ingested, and those associated with the presence of diseases or inflammatory processes.3,4 Regardless of the cause, malnutrition has been associated with worse clinical and functional outcomes and increased morbidity and mortality.5–8
One of the problems we encounter when assessing malnutrition in admitted patients is the lack of consensus regarding its definition and the criteria that the patient must meet to confirm malnutrition.9 Although there are multiple tools designed to assess malnutrition, none of them are universally accepted and they have presented little agreement between them when they have been compared.10–13 Since 2016, the Global Leadership Initiative on Malnutrition (GLIM) has sought to establish consensus on definitions and define a standard for the diagnosis of malnutrition.14 Some of the societies that developed the consensus have subsequently made adaptations aimed at the elderly population.15Fig. 1 details the consensus proposal for the screening and diagnosis of malnutrition.
.")
In addition to the difficulty in defining malnutrition, there are two other concepts that create confusion. On the one hand, the nutritional risk, which is not equivalent to malnutrition (e-table 1, supplementary material). On the other hand, malnutrition is sometimes labeled as weight loss secondary to a reduction in muscle mass in older patients that is associated with their age and is independent of the degree of nutrition.
Hospital admissions are a window of opportunity to detect malnutrition, nutritional risk or loss of muscle mass. To achieve this, it is necessary to carry out a systematized approach in which, with simple screening tools, patients who present any of the conditions described above can be detected.
The objective of our study was to assess the usefulness of different scales for both malnutrition screening and nutritional risk for the detection of malnutrition according to the GLIM definitions in hospitalized patients over 65 years of age, not institutionalized. As a secondary objective, the agreement between the different tools used was analyzed.
Patients and methodsThis observational study on the assessment of the usefulness of nutritional scales included patients from the FraMint (Frailty in patients admitted to Internal Medicine) cohort, a prospective cohort study on frailty in patients admitted to Internal Medicine.
The study was carried out between November 2022 and February 2023 in accordance with international recommendations on clinical research conducted with patients (Declaration of Helsinki of the World Medical Association, amended October 2013). The study was approved by the Ethics Committee for Research with Medicines (CEIm) of the Valladolid West Health Area (22-PI146). To write the article, the standards established in the checklist for diagnostic studies STARD 2015 (Standards for Reporting Diagnostic Accuracy) have been followed [accessible at https://www.equator-network.org/reporting-guidelines/stard/].
Study populationThe study population was selected as those over 65 years old admitted to an Internal Medicine ward. Only patients who were not institutionalized were chosen, because the aim was to assess the nutritional habits of the patients in their environment, when the patient himself or his environment are in charge of organizing his own diet, from the choice of food to the preparation of meals, thus being able to establish the nutritional risk.
The following inclusion criteria were established: (a) the participant being hospitalized, (b) being 65 years old or older, (c) residing at home, (d) being possible to obtain information from the patient himself or his main caregiver, (e) providing informed consent for participation in the study. The following exclusion criteria were established: (a) residing in a nursing home, (b) suffering from severe dementia, (c) suffering from a terminal illness that would grant a life expectancy of less than 6 months, (d) being fed exclusively by enteral or parenteral nutrition at the time of the evaluation, (e) existence of any physical or mental disability that would prevent them from granting informed consent or answering the different questionnaires required in the study, not having located a family member or caregiver.
Study variablesTo collect information, patients were evaluated during the first 48 h of their admission. The nursing team performed the anthropometric measurements and the MNA survey (Annex I, nurses who participated in the study). The rest of the surveys were conducted by IGF.
Epidemiological and clinical data were collected in relation to diagnosis and comorbidity, as well as anthropometric data: weight, height, and arm and calf circumferences of the patients. The force was assessed by applying a Jamar hydraulic dynamometer manufactured by Talexco.16 The analytical variables albumin (g/dl), total cholesterol (mg/dl) and total lymphocytes (1000/ul) were recognized. The Barthel dependency scales, Braden's risk of developing ulcers, and Downton's risk of falls were determined.
In relation to the nutritional assessment, 5 malnutrition risk screening scales were carried out, four of them clinical: (a) Mini Nutritional Assessment Short Form (MNA-SF),17 (b) Malnutrition Screening Tool (MST),18 (c) Universal Malnutrition Screening Tool (MUST19 and (d) Nutrition Risk Screening-2002 (NRS-2002),20 and a laboratory one: (e) Nutritional Control Scale (CONUT21 which is calculated according to the values of serum albumin, total cholesterol and lymphocyte count. In addition, the three variants of the Seniors in the Community: Risk Evaluation for Eating Nutrition (SCREEN) scale were carried out with 3, 8 and 14 questions22 (these scales are detailed in e-Annex 1 in supplementary material). The main characteristics of the different scales are described in e-table 2 (supplementary material).
Malnutrition reference standardAlthough there is no reference test or universal gold standard to define malnutrition, to establish the specificity and sensitivity of the different tools tested we have considered the criteria for confirming the diagnosis of malnutrition established by GLIM 14 as a reference to establish the diagnosis of malnutrition (see second stage of Fig. 1). According to the GLIM definitions, 5 parameters were considered:
- a)
Presence of weight loss. This parameter was considered when more than 5% of weight had been lost in the last 6 months or more than 10% over a longer period of time.
- b)
Low body mass index (BMI). This parameter was established as over 70 years of age if the BMI was less than 22 kg/m2. In patients aged 70 or younger if the BMI was less than 20 kg/m2.
- c)
Reduction of muscle mass. To define the reduction in muscle mass, the diameter of the forearm23 was used as a reference, using 22.5 cm as the reference value in our population.24
- d)
Reduction in intake or poor assimilation. It was considered if there was a decrease greater than or equal to 50% in energy requirements in the last week or any reduction for more than two weeks. This category is also considered if you have any gastrointestinal disease that has a negative influence on the assimilation or absorption of food.
- e)
Inflammation. To assess the presence of acute disease, the diagnosis at admission or during admission of severe infection, burns, trauma or head trauma was considered. To consider chronic disease, the presence of neoplasms, chronic obstructive pulmonary disease, heart failure, chronic kidney disease stages 3b, 4 or 5, or any other chronic disease or with recurrent inflammation was assessed.
The presence of malnutrition was established when patients met at least one phenotypic criterion (a, b or c) and another etiological criterion (d or e).
Sample sizeA sample size of 85 patients was calculated to obtain a malnutrition risk prevalence of 30%, with an acceptable error of 10%, an established confidence level of 0.95 and a percentage of estimated losses of 5% (calculated using the Sample Size Calculator package from Raosoft. Inc).
Statistical analysisThe data were coded and entered into Excel® and then edited with the statistical program SPSS® (Static Package for the Social Sciences) version 26.0.
The normality of the variables was determined using the Kolmogorov-Smirnov and Shapiro–Wilk tests. Given the distribution of the variables, the median and interquartile range were used to describe the continuous variables and absolute and relative frequencies for the categorical variables. Differences in variables based on sex were analyzed using the Mann–Whitney U test. The sensitivity, specificity and positive (LR+) and negative (LR−) likelihood ratios (LR) of the different nutritional tools were established to diagnose malnutrition according to the GLIM criteria. Finally, Cohen's weighted Kappa index was used to assess the degree of agreement between the different nutritional screening tools. The level of statistical significance was set at p < 0.05 for all analyses.
ResultsThe total sample is made up of 85 patients, with a median age of 83 years and 37% women. The reason for admission was an infectious condition in 42 patients (49%), decompensation of a cardiovascular disease in 16 (18%), digestive or neoplastic pathology in 6 (7.1%), study for syncope in 5 (5, 9%), head trauma in 3 (3.5%) and different causes in the remaining 7 patients.
Table 1 shows the baseline characteristics of the study population comparing patients with malnutrition versus patients without malnutrition. Differences were only detected in the anthropometric variables (weight, BMI, arm and calf circumference) and in the albumin value.
Sample characteristics.
| Total (n = 85) | Malnourished (n = 41) | Without malnutrition (n = 44) | P | |
|---|---|---|---|---|
| Women, n (%) | 32 (37) | 15 (37) | 17 (39) | 0,845 |
| Age (years), median (QR) | 83 (14) | 81 (14) | 85 (15) | 0,130 |
| Weight (kg), median (QR) | 70 (17) | 65 (16) | 72 (16) | 0,061 |
| Size (cm), median (QR) | 165 (12) | 168 (13) | 165 (13) | 0,345 |
| BMI (kg/m2), median (QR) | 25 (5) | 25 (5) | 27 (5) | 0,072 |
| Arm circumference (cm), median (QR) | 26 (4) | 25,5 (6) | 27 (4) | 0,011 |
| Calf circumference, (cm), median (QR) | 32 (5) | 31 (5) | 34 (6) | 0,012 |
| Grip strength (kg), median (QR) | 18 (17) | 18 (18) | 18 (14) | 0,503 |
| Dentition, n (%) (the patient: | 0.512 | |||
| Has all or almost all teeth | 27 (32) | 15 (37) | 12 (27) | |
| Has few teeth | 4 (5) | 2 (5) | 2 (5) | |
| Has dental prostheses | 52 (61) | 24 (59) | 28 (64) | |
| Neither has teeth nor uses dentures) | 2 (2) | 0 (0) | 2 (5) | |
| Barthel scale (points out of 100), median (QR) | 75 (45) | 75 (40) | 75 (63) | 0,259 |
| Braden scale (points out of 23), median (QR) | 20 (6) | 20 (5) | 20 (6) | 0,588 |
| Downton scale (points out of 4), median (QR) | 2 (2) | 2 (2) | 2 (2) | 0,132 |
| Hemoglobin (g/dl) | 12 (3) | 12 (3) | 12 (3) | 0,975 |
| Lymphocytes (totals/mL) | 1350 (950) | 1300 (1200) | 1400 (850) | 0,802 |
| Creatinine (mg/dl) | 0,9 (0,4) | 0,9 (0,3) | 1,0 (0,5) | 0,406 |
| Albumin (g/dl) | 3,3 (0,9) | 3,0 (0,9) | 3,3 (1,0) | 0,064 |
| Total cholesterol total (mg/dl)a | 151 (65) | 157 (61) | 150 (71) | 0,502 |
| C-reactive protein (mg/l) | 16 (47) | 17 (51) | 16 (59) | 0,563 |
BMI: body mass index, QR: interquartile range.
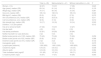
According to the GLIM criteria, 41 patients (48%; 95% CI 38–59) were classified as malnourished. Of the total subjects in the sample, 40% (95% CI 30–51) had unintentional weight loss, 6% (95% CI 3–13) had a low body mass index, 15% (CI 95% 9–24) a reduction in muscle mass (decrease in arm diameter <22.5 cm), 71% (95% CI 60–79) a reduction in intake or poor assimilation and 66% (95%% 55–75) active inflammation or chronic disease. Fig. 2 details the sensitivity and specificity values of the different tools used to detect malnutrition according to the GLIM criteria. The most sensitive test was SCREEN 3, with 93% (95% CI 87–98), and it was also the test with the greatest effectiveness in ruling out malnutrition if it was negative (LR− 0.17, 95% CI 0.05−0.53). The 2 most specific tests were MUST, with 91% (95% CI 85–97) and MST with 89% (95% CI 82–95), respectively, both being the tests with the greatest effectiveness in confirming the diagnosis when they were positive. (LR+ 5.10, 95% CI 1.89–13.73 and 7.08, 95% CI 3.06–16.39 respectively). The CONUT scale, the only one based on analytical parameters, obtained LR+ and LR− values close to 1, which rules it out as a tool that can be used for malnutrition screening according to the GLIM parameters.
![Forest diagram with the diagnostic parameters (sensitivity, specificity, positive and negative likelihood ratio [LR]) of the different nutritional tools to diagnose malnutrition according to the criteria proposed by the Global Initiative for Leadership in Malnutrition (GLIM).](https://static.elsevier.es/multimedia/22548874/0000022400000004/v3_202405261152/S2254887424000419/v3_202405261152/en/main.assets/gr2.jpeg?xkr=FGFA6X66eBGksCdreAKW45UFAsvq79ERH+7yEhIOjEJ2Cm/HVAKRxWC92Jt63IPGIO81+3exQpb0oFIHh/P23OXGgw9vyYbkilxh+AngKgKdk9U2vpVCPhSF7INoNATdazkLvx2KnnvEMmRIrSeq1tUoPEnhnuvhHd+Lq6wiEr5B/QwvNMvcpj8jSJQe1rN1O62QEt1jSAXaMSx0HJMAjF6bTWnAHuhaIXuQ50nwBy3nj0bHwRK2Xg+63IeEOXSRa4MH3fQ5VBI283yrAGqNbzcE/oi9cDeg6xJemGsk3BM= "Forest diagram with the diagnostic parameters (sensitivity, specificity, positive and negative likelihood ratio [LR]) of the different nutritional tools to diagnose malnutrition according to the criteria proposed by the Global Initiative for Leadership in Malnutrition (GLIM).")
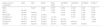
The agreement between the different scales was very low, as shown by the Kappa index and the percentage of agreement shown in Table 2 and e-table 3 (supplementary material). Fig. 3 graphically details the agreement in diagnoses between the 4 nutritional screening tools for the diagnosis of patients with malnutrition or at risk of malnutrition. E-figure 1 compares the results obtained according to MNA, the most used malnutrition scale, CONUT, the only laboratory scale used, and SCREEN 14, one of the nutritional risk scales tested.
Concordance analysis of the results obtained through the different nutritional screening tools according to the Kappa Index and the concordant percentage.
| Kappa index % concordant | MNA | MST | MUST | NRS-2002 | SCREEN-14 | SCREEN-8 | SCREEN-3 | CONUT |
|---|---|---|---|---|---|---|---|---|
| MNA | 0.220 | 0.082 | 0.093 | 0.352 | 0.390 | 0.321 | 0.136 | |
| MST | 60.20% | 0.374 | 0.465 | 0.374 | 0.440 | 0.399 | 0.043 | |
| MUST | 49.40% | 69.90% | 0.189 | 0.123 | 0.202 | 0.190 | 0.038 | |
| NRS-2002 | 59.00% | 72.30% | 51.80% | 0.279 | 0.160 | 0.056 | 0.080 | |
| SCREEN-14 | 71.10% | 67.50% | 47.00% | 71.10% | 0.674 | 0.592 | 0.051 | |
| SCREEN-8 | 72.30% | 71.10% | 53.00% | 65.50% | 86.70% | 0.700 | −0.009 | |
| SCREEN-3 | 69.60% | 68.70% | 50.60% | 62.70% | 84.30% | 88.00% | −0.067 | |
| CONUT | 56.70% | 52.20% | 52.20% | 53.70% | 52.20% | 49.30% | 46.30% |
CONUT: CONtrolling NUTritional status; MNA-SF: Short-Form Mini Nutritional Assessment; MST: Malnutrition Screening Tool; MUST: Malnutrition Universal Screening Tool; NRS-2002: Nutritional Risk Screening-2002; SCREEN: Seniors in the Community: Risk Evaluation for Eating Nutrition.

Malnutrition is very common in elderly hospitalized patients, even in those who are not institutionalized. Different tools have been proposed to facilitate malnutrition screening in this group of patients. To the best of our knowledge, this is the first study where nutritional risk tools (SCREEN family) are tested to assess the presence of malnutrition. In our series, the effectiveness of these nutritional risk screening tests was higher in ruling out malnutrition than that of the classic malnutrition risk screening tools, which makes them possible candidates to be used as the first step in screening.
The high percentage of patients with malnutrition, defined according to the GLIM criteria, detected in our series is similar to that published in other series of patients admitted with similar ages25 and somewhat higher than series26,27 with younger patients where malnutrition is among the 30 and 40%, or in elderly patients not admitted28 where it is around 30%.
One of the main problems when approaching the detection of malnutrition is deciding which screening tool to choose to start the process to confirm malnutrition. As in other series,26,28,29 the differences in the percentage of patients identified by each of them make it difficult to establish what each one is really measuring. Some of the nutrition screening tools tested (MST or MUST) had high specificity, but with lower sensitivity to detect malnourished patients according to the GLIM criteria, which makes the positive results of the screening test reliable. But it would mean that patients at risk of malnutrition would not be included given the low discriminative value of negative results. On the other hand, the NRS-2002 tool would have high sensitivity with low specificity, which would make it useful as an initial screening by including the majority of malnourished patients. The low values of the MNA tools and especially CONUT stand out, whose probability ratios (LR+ 1.25 and 1.03 and LR− 0.70 and 0.97 respectively) were not useful in our series either to rule out or to confirm the diagnosis. In the case of the nutritional risk detection tools of the SCREEN family, their sensitivity stands out, especially in the simplest of them, the SCREEN-3 with only three questions (Has your weight changed in the last 6 months? How would you describe your appetite? Do you cough, choke, or have pain when swallowing food or liquids?). The SCREEN tools assess the factors that put people at risk of having poor food intake, which can lead to malnutrition since it would be an intake that does not comply with nutritional recommendations. This also has the advantage of identifying nutritional risk, a variable that both nutritionists and other healthcare personnel can influence by providing guidance and advice on nutrition.
After the analysis of the screening tests studied, none of them were ideal since, as described in the previous paragraph, none simultaneously presented high sensitivity and specificity. This forces a decision to be made about whether to opt for the more sensitive tests such as NRS-2002 or SCREEN (useful for ruling out patients with negative test results) or for the more specific ones such as MST or MUST (useful for confirming patients) with positive results). In the case of malnutrition screening, we think that it is more interesting to use tests with high sensitivity, since this would detect the majority of patients, even if non-malnourished patients were included. In this case, false positive results would only harm the patient if people without malnutrition were evaluated more completely according to the GLIM criteria. Given the ease of determining these and that they do not include any invasive test, it does not seem to be an important limitation regarding the risk of not detecting subjects with malnutrition if tests with less sensitivity were used. SCREEN 3 with an LR− of 0.17 was, in our series, the most effective test for the initial screening of patients.
Our study has certain limitations when interpreting its results, mainly in relation to the representativeness of the sample. First, a convenience sample was chosen, excluding institutionalized patients, which limits its extrapolation to this population group. The reason for this exclusion was to select patients on whom a nutritional intervention could be performed during the hospital period before returning home, where the patient themselves or their environment are responsible for preparing and selecting the meals. Secondly, the sample size achieved corresponds to a calculation based on an estimated percentage, according to the literature, of 30% of malnourished patients. The finding of 51% in our series would have required a slightly larger sample, specifically 101 patients, to adjust to the expected sample size for said frequency of events. Thirdly, there is no gold reference standard for the diagnosis of malnutrition, so we have used the most universally accepted criteria as a reference, such as the GLIM. Fourthly, the study is cross-sectional, so we do not know the value of the tools analyzed when establishing the prognosis of the patients. Finally, the determination of the CONUT tool was not carried out in the entire sample, as the collection of the cholesterol value in a regulated manner was not established.
This study has confirmed what was previously described in the literature about the poor agreement that exists between the different malnutrition detection tools. Within future lines of research, a prospective assessment of the ability of these same tools to predict patient prognosis in terms of mortality or hospital readmission is required.
There is a high risk of malnutrition in older patients, especially those admitted to hospital. Hospital admission is an ideal window of opportunity to screen patients to detect those at risk of malnutrition. The use of tools with high sensitivity as an initial approach allows the diagnosis to be safely ruled out in patients with a negative result. In a second step, a more complete nutritional assessment will confirm the diagnosis. The use of nutritional risk tools compared to the classic malnutrition risk tools has the advantage of also including the assessment of risk factors for insufficient nutrition, including dietary habits, with which a more personalized approach can be built for the patient treatment of malnutrition in our patients.
Conflict of interestAll authors declare that they have no conflict of interest.
FundingThis work was not funded by any organisation.
Availability of data and materialsThe data supporting the findings of this study are available upon reasonable request to the corresponding author.
We thank the nursing team on floor 3.0 of the Río Hortega University Hospital for facilitating the collection of this study data.
Nursing team participating in the FRAMint study (2022–2023).
Angela Almudi Gil, Mercedes Aranda Martín, Teresa Arroyo Gallego, Carmen Bermejo Lorenzo, Nuria De La Cruz Gonzalez, David De La Fuente Díez, David De La Horra Parra, Cristina Dengan Garcia, Amaya Fernández Fernández, Angela García Antolín, Alba Garcia Maldonado, Cristina Gil Peña, Pilar Gutiérrez Tejedor, Ana Belén Legido, Ainhoa Martín Galán, Julia Pérez Nieto, Laura Nuñez Vazquez, Elena Olivar Paz, Victoria Eugenia Olivet De La Fuente, Irene Peña Olivar, Marta Sahagún Olea, Laura Santamaría Gonzalez, Irene Sanz Del Cura, Asunción Vaca Bachiller.
Elena De Paz Collantes.
The following is Supplementary data to this article:


