

Socioeconomic deprivation is a well-recognized determinant of cardiovascular health. We evaluated its influence on cardiovascular risk and damage in patients with systemic lupus erythematosus (SLE) in the Basque Country, where universal healthcare coverage is guaranteed.
MethodsObservational cohort study including 293 SLE patients with a 5-year follow-up. The association between the Basque Country’s Socioeconomic Deprivation Index and cardiovascular risk factors and damage (SLICC index) was analyzed using multilevel generalized linear mixed models.
ResultsNo significant associations were found between deprivation levels and the number of cardiovascular risk factors at diagnosis or at 5 years, nor with cardiovascular damage. Age at diagnosis and disease activity were the main predictors of cardiovascular outcomes.
ConclusionIn a universal healthcare setting, socioeconomic deprivation was not associated with worse cardiovascular risk or damage in SLE patients. These findings do not establish causality but are consistent with the hypothesis that universal healthcare may mitigate socioeconomic gradients in SLE cardiovascular outcomes.
La privación socioeconómica es un determinante de salud cardiovascular bien establecido. Evaluamos su influencia en el riesgo y daño cardiovascular en pacientes con lupus eritematoso sistémico (LES) en el País Vasco, donde existe cobertura sanitaria universal.
MétodosCohorte observacional de 293 pacientes con LES con un seguimiento de 5 años. Se analizó la asociación entre el Índice de Privación Socioeconómica del País Vasco y los factores de riesgo y daño cardiovascular (índice SLICC) utilizando modelos lineales mixtos generalizados multinivel.
ResultadosNo se encontraron asociaciones significativas entre la privación y el número de factores de riesgo cardiovascular al diagnóstico ni a los 5 años, ni con el daño cardiovascular. La edad y la actividad del LES fueron los principales determinantes.
ConclusionesEn un entorno de asistencia sanitaria universal, la privación socioeconómica no se asoció con riesgo o daño cardiovascular en pacientes con LES. Estos hallazgos no permiten inferir causalidad, pero son compatibles con la hipótesis de que la sanidad universal podría atenuar los gradientes socioeconómicos en los resultados cardiovasculares del LES.

Systemic lupus erythematosus (SLE) is a chronic autoimmune disease characterized by a wide range of clinical manifestations and a significant burden of comorbidities, particularly cardiovascular disease.1,2 Cardiovascular risk in SLE patients is notably higher compared to the general population, driven by both traditional and disease-specific risk factors, such as chronic inflammation and prolonged glucocorticoid use.3 The literature consistently highlights that social determinants of health, including socioeconomic deprivation, significantly influence health outcomes in various chronic diseases.4 Socioeconomic status has been linked to disparities in SLE outcomes, with lower socioeconomic status associated with higher morbidity and mortality, partly due to limited access to healthcare, lower health literacy, and increased prevalence of unhealthy behaviors.5,6
Most research on health disparities in SLE has focused on contexts with significant variations in healthcare access, such as low- and middle-income countries or regions with fragmented healthcare systems.5,7 Studies have demonstrated that, in these settings, socioeconomic deprivation exacerbates health inequities, leading to poorer outcomes among SLE patients.6,7 These findings underscore the critical role of social determinants in shaping health trajectories and highlight the need for targeted interventions to mitigate these effects.4,6
However, the impact of socioeconomic deprivation in regions with universal healthcare coverage, such as the Basque Country/Euskadi,8 in Spain, remains underexplored. The Basque Country provides a unique context due to its comprehensive public healthcare system, universal and free to access, with a widespread net of primary care and extra-hospital specialized services, interconnected with county and university hospitals, some of them with reference units for autoimmune diseases, such as Cruces University Hospital.8 Patients with SLE from all over the Basque Country can easily access to our referral unit. Besides, the small size and good communications of our country make it easy for patients to keep close contact both with primary and specialized health providers. This study aimed to investigate the impact of socioeconomic deprivation on cardiovascular risk and damage in SLE patients within a universal healthcare setting in the Basque Country, Spain.
Material and methodsPatientsThis observational fixed cohort study included 293 patients with SLE in prospective follow-up from the Autoimmune Diseases Research Unit at Hospital Universitario Cruces, the Basque Country, Spain. All patients met the 1997 American College of Rheumatology criteria for SLE,9 and were enrolled at the time of diagnosis with a minimum follow-up period of 5 years. No formal a priori sample-size calculation was performed. Informed consent was obtained from all participants, and the study protocol was approved by the local institutional review board in accordance with the Declaration of Helsinki.
Socioeconomic deprivationSocioeconomic deprivation was assessed using the Basque Socioeconomic Deprivation Index (B-SDI), which comprises seven indicators: unemployment, manual worker population, temporary worker population, low educational attainment in the population aged 16 and over, low educational attainment in the population aged 16 to 29, foreign-born population from low-income countries, and recipients of income support. It does not include individual/household annual income, and therefore our deprivation measure reflects contextual, multidimensional disadvantage rather than personal income. Each patient was assigned a deprivation quintile (Q1 to Q5), with Q1 representing the most favorable socioeconomic status and Q5 the most deprived.10 Our justification for using B-SDI is based on validation in our environment and complete geocoded coverage throughout the study period.
Cardiovascular outcomesThe number of cardiovascular risk factors, including dyslipidemia, smoking, diabetes mellitus and hypertension, were assessed at diagnosis and at 5 years. Obesity was not evaluated due to the lack of data to calculate BMI in all participants. Cardiovascular damage was evaluated using the following multi-domains definition based on the Systemic Lupus International Collaborating Clinics (SLICC) Damage Index,11 as defined in previous studies by our group: cerebrovascular accident, angina or coronary bypass, myocardial infarction, ventricular dysfunction, or claudication lasting ≥6 months.12
Data collectionDemographic, clinical, analytical, and therapeutic data were collected at diagnosis and at 5 years of follow-up. Variables included age at diagnosis, sex, origin (European vs non-European), SLE Disease Activity Index (SLEDAI-2 K) score.13 The cumulative dose of prednisone and the number of months on treatment with hydroxychloroquine (HCQ) was assessed during the first year of follow-up.
Statistical analysisDescriptive analyses were performed to compare demographic, clinical, analytical, and therapeutic characteristics across the deprivation quintiles. Categorical variables were expressed as absolute and relative frequencies and compared using the chi-square test. Continuous variables were expressed as medians and interquartile ranges (IQR) and compared using the Kruskal-Wallis test due to their non-parametric distribution.
To evaluate the effect of socioeconomic deprivation on cardiovascular outcomes, we fitted multilevel generalized linear mixed models. For the outcomes ‘number of cardiovascular risk factors at diagnosis’ and ‘at 5 years’ (count, range 0–4), we used Poisson regression with a log link, reporting rate ratios (incidence rate ratios, RR) with 95% CIs. For ‘cardiovascular damage at 5 years’ (binary), we used multilevel logistic regression, reporting odds ratios (OR) with 95% CIs. Models were adjusted for age at diagnosis, sex, origin, SLEDAI-2 K, first-year cumulative prednisone dose (mg), and months on hydroxychloroquine.14 We assessed (over)dispersion using Pearson/deviance statistics and applied a scale (robust) adjustment to standard errors when indicated.
Data analysis was performed using IBM SPSS Statistics software (version 25), and significance was set at p < 0.05.
ResultsPatient characteristics by deprivation quintileThe baseline characteristics of the 293 SLE were stratified according to socioeconomic deprivation quintiles. As shown in Table 1, there were no significant differences in most demographic, clinical, laboratory, or therapeutic characteristics across the deprivation quintiles (all p-values > 0.05), except for the presence of anti-DNA antibodies. For other variables, the median age at diagnosis ranged from 31 to 37 years across quintiles, and the percentage of female patients varied from 81.8% to 94.4%. The prevalence of non-European patients ranged from 1.6% to 7.3%.
SLE Patients' baseline characteristics according to socioeconomic deprivation.
| Domain | Variable | Total N = 293 | Socioeconomic deprivation | p | ||||
|---|---|---|---|---|---|---|---|---|
| Quintile 1 n = 54 | Quintile 2 n = 61 | Quintile 3 n = 62 | Quintile 4 n = 61 | Quintile 5 n = 55 | ||||
| Demographics | Age at diagnosis, median (interquartile range) | 34 (25 to 43.5) | 32 (23.7 to 44.7 | 37 (27 to 44) | 35.5 (27.7 to 46.5) | 31 (24 to 40.5) | 33.4 (24 to 43) | 0.362 |
| Female sex (%) | 258 (88.1) | 51 (94.4) | 55 (90.2) | 53 (85.5) | 54 (88.5) | 45 (81.8) | 0.312 | |
| Non-European (%) | 13 (4.4) | 2 (3.7) | 4 (3.2) | 2 (3.2) | 1 (1.6) | 4 (7.3) | 0.542 | |
| Disease Characteristics | Skin involvement (%) | 164 (56) | 29 (53.7) | 32 (52.5) | 34 (54.8) | 40 (65.6) | 29 (52.7) | 0.567 |
| Joint involvement (%) | 174 (59.4) | 29 (53.7) | 38 (62.3) | 40 (64.5) | 35 (57.4) | 32 (58.2) | 0.785 | |
| Serosal involvement (%) | 59 (20.1) | 16 (29.6) | 13 (21.3) | 11 (17.7) | 9 (14.8) | 10 (18.2) | 0.341 | |
| Hematological involvement (%) | 197 (67.2) | 40 (74.1) | 39 (63.9) | 41 (66.1) | 43 (70.5) | 34 (61.8) | 0.648 | |
| Renal involvement (%) | 36 (12.3) | 7 (13) | 7 (11.5) | 5 (8.1) | 9 (14.8) | 8 (14.5) | 0.791 | |
| Central nervous system involvement (%) | 12 (4) | 1 (1.8) | 3 (4.9) | 1 (1.6) | 5 (8.2) | 2 (3.6) | 0.437 | |
| Antiphospholipid síndrome (%) | 13 (4.4) | 3 (5.6) | 2 (3.3) | 2 (3.2) | 2 (3.3) | 4 (7.3) | 0.811 | |
| Immunological Characteristics | Anti-DNA antibodies (%) | 163 (55.6) | 37 (68.5) | 27 (44.3) | 29 (46.8) | 35 (57.4) | 35 (63.6) | 0.035 |
| Anti Sm antibodies (%) | 48 (16.4) | 9 (16.7) | 8 (13.1) | 5 (8.1) | 13 (21.3) | 13 (23.6) | 0.147 | |
| Anti Ro antibodies (%) | 105 (35.8) | 16 (29.6) | 20 (32.8) | 19 (30.6) | 28 (45.9) | 22 (40) | 0.292 | |
| Anti La antibodies (%) | 37 (12.6) | 5 (9.3) | 7 (11.5) | 10 (16.1) | 6 (9.8) | 9 (16.4) | 0.657 | |
| Anti RNAP antibodies (%) | 58 (19.8) | 6 (11.1) | 17 (27.9) | 10 (16.1) | 10 (16.4) | 15 (27.3) | 0.092 | |
| Anticardiolipin antibodies (%) | 70 (23.9) | 16 (29.6) | 15 (24.6) | 13 (21) | 10 (16.4) | 16 (29.1) | 0.409 | |
| Lupus anticoagulant (%) | 55 (18.8) | 9 (16.7) | 12 (19.7) | 10 (16.1) | 10 (16.4) | 14 (25.5) | 0.684 | |
| Anti β2 glycoprotein 1 antibodies* (%) | 7 (4.9) | 0 (0) | 3 (8.8) | 1 (3) | 3 (12) | 0 (0) | 0.148 | |
| Hypocomplementemia (%) | 165 (56.3) | 24 (44.4) | 35 (57.4) | 35 (56.5) | 37 (60.7) | 34 (61.8) | 0.374 | |
| Disease activity | SLEDAI-2 K, median (interquartile range) | 6 (4 to 10) | 5 (4 to 12) | 5 (3.5 to 10) | 5.5 (4 to 8) | 7 (4 to 11) | 6 (2 to 10) | 0.395 |
| Cumulative damage | Cardiovascular damage (%) | 2 (0.7) | 1 (1.9) | 0 (0) | 1 (1.6) | 0 (0) | 0 (0) | 0.500 |
| Cardiovascular risk factors | Arterial hypertension(%) | 37 (12.6) | 6 (11.1) | 6 (9.8) | 9 (14.5) | 7 (11.5) | 9 (16.4) | 0.832 |
| Diabetes mellitus (%) | 8 (2.7) | 0 (0) | 2 (3.3) | 3 (4.8) | 2 (3.3) | 1 (1.8) | 0.658 | |
| Smoking (%) | 69 (23.5) | 14 (25.9) | 13 (21.3) | 13 (21) | 13 (21.3) | 16 (29.1) | 0.800 | |
| Dyslipidemia (%) | 62 (21.2) | 17 (31.5) | 15 (24.6) | 9 (14.5) | 7 (11.5) | 14 (25.5) | 0.048 | |
| Number of cardiovascular risk factors, median (interquartile range) | 0 (0 to 1) | 1 (0 to 1) | 0 (0 to 1) | 0 (0 to 1) | 0 (0 to 1) | 1 (0 to 1) | 0.168 | |
| Treatments received | Prednisone cumulative dose, median (interquartile range) | 1545 (0 to 3450) | 1849 (399 to 4481) | 1350 (0 to 2492) | 1743 (338 to 3159) | 1800 (0 to 3375) | 1430 (630 to 3600) | 0.489 |
| Methylprednisolone pulses (%) | 63 (21.5) | 11 (20.4) | 9 (14.8) | 16 (25.8) | 11 (18) | 16 (29.1) | 0.325 | |
| Months with hydroxychloroquine, median (interquartile range) | 12 (0 to 12) | 11.5 (0 to 12) | 12 (0 to 12) | 11 (0 to 12) | 12 (0 to 12) | 12 (0 to 12) | 0.604 | |
| Methotrexate (%) | 18 (6.1) | 2 (3.7) | 3 (4.9) | 5 (8.1) | 1 (1.6) | 7 (12.7) | 0.140 | |
| Azathioprine (%) | 31 (10.6) | 7 (13) | 3 (4.9) | 7 (11.3) | 8 (13.1) | 6 (10.9) | 0.592 | |
| Mycophenolate mofetil (%) | 14 (4.8) | 2 (3.7) | 2 (3.3) | 3 (4.8) | 3 (4.9) | 4 (7.3) | 0.899 | |
| Cyclosporine (%) | 1 (0.3) | 0 (0) | 0 (0) | 0 (0) | 0 (0) | 1 (1.8) | 0.370 | |
| Cyclophosphamide (%) | 32 (10.9) | 8 (14.8) | 5 (8.2) | 5 (8.1) | 5 (8.2) | 9 (16.4) | 0.418 | |
| Vitamin D supplements (%) | 114 (38.9) | 17 (31.5) | 25 (41) | 24 (38.7) | 19 (31.1) | 29 (52.7) | 0.120 | |
| Bisphosphonates (%) | 16 (5.4) | 5 (9.2) | 4 (6.6) | 4 (6.5) | 1 (1.6) | 2 (3.6) | 0.389 | |
| Acetylsalicylic acid (%) | 75 (25.6) | 15 (27.8) | 21 (34.4) | 14 (22.6) | 12 (19.7) | 13 (23.6) | 0.388 | |
| Statins (%) | 21 (7.1) | 5 (9.2) | 5 (8.2) | 3 (4.8) | 4 (6.6) | 4 (7.3) | 0.896 | |
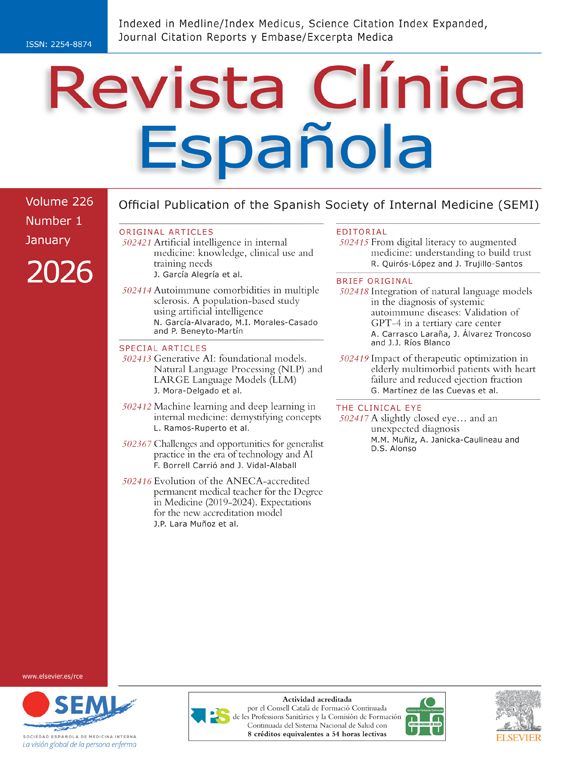
The results of the multilevel generalized linear mixed models are presented in Fig. 1. Dispersion statistics did not indicate relevant overdispersion; we nonetheless used robust standard errors as a conservative approach; inferences were unchanged. The analysis indicated no significant association between socioeconomic deprivation and the number of cardiovascular risk factors at diagnosis or at 5 years. Specifically, the RR for the number of cardiovascular risk factors at diagnosis in the highest deprivation quintile (Q5) compared to the most favorable quintile (Q1) was 1.085 (95% CI: 0.713-1.654, p = 0.702). Similarly, at the 5-year follow-up, the RR for Q5 vs. Q1 was 0.977 (95% CI: 0.647-1.475, p = 0.911).

Socioeconomic deprivation and cardiovascular outcomes in SLE patients: multilevel generalized linear mixed models results.
(A and B) display rate ratios (incidence rate ratios) from Poisson models (log link) for the count of cardiovascular risk factors. (C) displays odds ratios from logistic models for cardiovascular damage at 5 years.
Additionally, no significant association was found between socioeconomic deprivation and cardiovascular damage at 5 years. The OR for cardiovascular damage at 5 years in Q5 vs. Q1 was 1.131 (95% CI: 0.162-7.898, p = 0.901). Cardiovascular damage at diagnosis was not evaluated due to its occurrence in only two patients.
Due to the low number of male and non-European patients, stratified analyses by these categories were not performed. Detailed results of the multivariate models are provided in Table 2.
Multivariate analysis of cardiovascular risk factors and damage in SLE patients.
| Outcome | Model | Variable | p | Association measure | Lower limit of the 95% confidence interval | Upper limit of the 95% confidence interval |
|---|---|---|---|---|---|---|
| Number of cardiovascular risk factors at diagnosis | Without socioeconomic deprivation | Intercept | 0.000 | 0.215 | 0.119 | 0.388 |
| Age at diagnosis | 0.000 | 1.029 | 1.019 | 1.038 | ||
| Female sex | 0.009 | 0.628 | 0.443 | 0.891 | ||
| Non-European | 0.778 | 1.089 | 0.602 | 1.970 | ||
| SLEDAI-2 K | 0.000 | 1.046 | 1.023 | 1.069 | ||
| With socioeconomic deprivation | Intercept | 0.014 | 0.364 | 0.163 | 0.815 | |
| Age at diagnosis | 0.000 | 1.020 | 1.011 | 1.030 | ||
| Female sex | 0.145 | 0.761 | 0.527 | 1.099 | ||
| Non-European | 0.934 | 1.025 | 0.565 | 1.861 | ||
| SLEDAI-2 K | 0.002 | 1.036 | 1.014 | 1.059 | ||
| Quintile 1 | Reference | |||||
| Quintile 2 | 0.882 | 0.969 | 0.638 | 1.471 | ||
| Quintile 3 | 0.520 | 0.871 | 0.572 | 1.328 | ||
| Quintile 4 | 0.743 | 0.932 | 0.613 | 1.419 | ||
| Quintile 5 | 0.702 | 1.085 | 0.713 | 1.654 | ||
| Number of cardiovascular risk factors at the 5-year follow-up | Without socioeconomic deprivation | Intercept | 0.001 | 0.376 | 0.207 | 0.682 |
| Age at diagnosis | 0.000 | 1.027 | 1.018 | 1.037 | ||
| Female sex | 0.001 | 0.570 | 0.409 | 0.796 | ||
| Non-European | 0.893 | 0.959 | 0.518 | 1.775 | ||
| SLEDAI-2 K | 0.000 | 1.051 | 1.027 | 1.076 | ||
| Prednisone cumulative dose | 0.187 | 1.000 | 1.000 | 1.000 | ||
| Months with hydroxychloroquine | 0.002 | 0.961 | 0.937 | 0.985 | ||
| With socioeconomic deprivation | Intercept | 0.065 | 0.520 | 0.259 | 1.043 | |
| Age at diagnosis | 0.000 | 1.019 | 1.010 | 1.029 | ||
| Female sex | 0.072 | 0.722 | 0.506 | 1.030 | ||
| Non-European | 0.759 | 0.907 | 0.485 | 1.698 | ||
| SLEDAI-2 K | 0.001 | 1.040 | 1.016 | 1.064 | ||
| Prednisone cumulative dose | 0.563 | 1.000 | 1.000 | 1.000 | ||
| Months with hydroxychloroquine | 0.123 | 0.980 | 0.956 | 1.005 | ||
| Quintile 1 | Reference | |||||
| Quintile 2 | 0.532 | 0.878 | 0.584 | 1.321 | ||
| Quintile 3 | 0.757 | 0.940 | 0.635 | 1.392 | ||
| Quintile 4 | 0.843 | 0.843 | 0.560 | 1.270 | ||
| Quintile 5 | 0.911 | 0.977 | 0.647 | 1.475 | ||
| Cardiovascular damage at the 5-year follow-up | Without socioeconomic deprivation | Intercept | 0.005 | 0.001 | 0.000 | 0.100 |
| Age at diagnosis | 0.007 | 1.096 | 1.026 | 1.171 | ||
| Female sex | 0.910 | 0.855 | 0.056 | 12.980 | ||
| Non-European | 0.999 | 0.000 | 0.000 | - | ||
| SLEDAI-2 K | 0.815 | 1.026 | 0.829 | 1.269 | ||
| Prednisone cumulative dose | 0.707 | 1.000 | 1.000 | 1.000 | ||
| Months with hydroxychloroquine | 0.668 | 0.959 | 0.793 | 1.160 | ||
| With socioeconomic deprivation | Intercept | 0.007 | 0.011 | 0.000 | 0.285 | |
| Age at diagnosis | 0.075 | 1.037 | 0.996 | 1.079 | ||
| Female sex | 0.944 | 0.941 | 0.167 | 5.288 | ||
| Non-European | 0.742 | 0.584 | 0.024 | 14.491 | ||
| SLEDAI-2 K | 0.919 | 1.006 | 0.895 | 1.131 | ||
| Prednisone cumulative dose | 0.846 | 1.000 | 1.000 | 1.000 | ||
| Months with hydroxychloroquine | 0.769 | 0.983 | 0.879 | 1.100 | ||
| Quintile 1 | Reference | |||||
| Quintile 2 | 0.999 | 1.001 | 0.151 | 6.620 | ||
| Quintile 3 | 0.672 | 1.447 | 0.261 | 8.035 | ||
| Quintile 4 | 0.951 | 1.060 | 0.160 | 7.050 | ||
| Quintile 5 | 0.901 | 1.131 | 0.162 | 7.898 | ||
SLEDAI-2 K, SLE Disease Activity Index.
This study aimed to investigate the influence of socioeconomic deprivation on cardiovascular risk and damage in SLE patients from the Lupus-Cruces Cohort in the Basque Country, Spain. By examining a cohort with free and universal access to primary and specialized healthcare, we sought to understand whether the well-documented associations between socioeconomic deprivation and adverse health outcomes persist in a context where healthcare accessibility is not a limiting factor.
Our results indicate no significant associations between socioeconomic deprivation and the number of cardiovascular risk factors at diagnosis or at 5 years. Additionally, there was no significant association between socioeconomic deprivation and cardiovascular damage at 5 years. Interestingly, significant variables in our models included age at diagnosis and SLEDAI-2 K score, which were consistently associated with cardiovascular risk factors both at diagnosis and at the 5-year follow-up. This highlights the critical role of disease activity and age in cardiovascular health among SLE patients.3,14
The lack of a significant association between socioeconomic deprivation and cardiovascular risk and damage is consistent with the hypothesis that the comprehensive and equitable healthcare system in the Basque Country may mitigate the effects of socioeconomic disparities4,8; however, causality cannot be inferred and alternative explanations (residual confounding, limited power) remain possible. Universal access to healthcare likely reduces barriers to receiving timely and adequate medical care, thereby leveling the playing field across different socioeconomic groups.4 This contrasts sharply with findings from studies conducted in regions with less equitable healthcare systems, such as the United States, where socioeconomic deprivation significantly exacerbates health disparities.2,5–7
Other factor that may influence our findings in that the socioeconomic the B-SDI might capture deprivation differently compared to indices used in other studies.15 The specific components of this index, such as unemployment rates and educational attainment, may not directly influence health outcomes in the same way across different regions.10 Additionally, the relatively small sample size and the potential homogeneity within the Basque population could have limited the variability needed to detect significant differences.
Our study benefits from several methodological strengths that enhance the credibility and relevance of our findings. First, the longitudinal design allowed us to capture the evolution of cardiovascular risk and damage over time, providing a dynamic view of disease progression in SLE patients. The use of the Basque Socioeconomic Deprivation Index,10 tailored to the specific context of the Basque Country, enabled precise measurement of socioeconomic status, reflecting local social and economic conditions more accurately than broader indices.16 Furthermore, the incorporation of multilevel generalized linear mixed models facilitated a robust analysis by accounting for the hierarchical structure of the data and controlling for both individual-level and contextual variables. This comprehensive approach ensured that we could isolate the impact of socioeconomic deprivation on cardiovascular outcomes while considering a range of relevant clinical and demographic factors. Finally, our study's setting within a universal healthcare system offers unique insights into how equitable access to healthcare can influence health outcomes, adding a valuable dimension to the existing literature on health disparities.4–6,8,16
However, our study has also some limitations. This was a fixed, consecutive cohort with no a priori sample-size calculation; analyses are therefore precision-based, and the study was underpowered to detect small-to-moderate effects, as reflected by wide confidence intervals. Power was especially limited for key subgroups (e.g., men, migrants) and for finer deprivation strata, which restricts generalizability. BMI was not systematically recorded and could not be reliably retrieved; its omission may confound estimates, so future studies should include adiposity measures. Socioeconomic exposure was measured with the B-SDI, an area-level composite that includes “recipients of income support” but not individual/household income (nor personal education or occupation); thus, residual socioeconomic status confounding and non-differential exposure misclassification (likely biasing toward the null) are possible. The cohort’s relatively young age yielded few cardiovascular damage events over five years; we complemented event outcomes with a count of cardiovascular risk factors to capture earlier risk burden, yet modest associations may remain undetected. Finally, the observational design precludes causal inference; replication in larger, multicenter cohorts with longer follow-up, additional individual-level socioeconomic status dimensions, and in health systems with different financing models is warranted.6
The findings of this study have important implications for clinical practice and public health. They suggest that in regions with universal healthcare coverage, socioeconomic deprivation may not be a primary determinant of cardiovascular outcomes in SLE patients. This highlights the potential of comprehensive healthcare systems to mitigate health disparities and improve outcomes for disadvantaged populations, reinforcing the role of public universal health systems in the construction of more advanced and fair societies, in a time when health provisioning is being considered as a privilege and an opportunity for business in many parts of the world.4,8,16
In conclusion, in our cohort cared for within a universal healthcare system, socioeconomic deprivation was not associated with cardiovascular risk factors or damage over five years. These descriptive findings do not establish causality but are consistent with the hypothesis that universal access may mitigate socioeconomic gradients. Replication in larger, multicenter cohorts and other health-system contexts is needed.
Informed consentInformed consent was obtained from all subjects involved in the study.
Ethics approvalThis study was conducted according to the guidelines of the Declaration of Helsinki and approved by the Research Ethics Committee of Hospital Universitario de Cruces (Spain). Ethics Committee code: E08/35.
FundingG. Ruiz-Irastorza was supported by the Department of Education of the Basque Government, research grant IT 1512-22. H. Hernandez-Negrin was supported by Consejería de Transformación Económica, Industria, Conocimiento y Universidades, Junta de Andalucía-Sevilla (Spain), research grant PREDOC-00826.
Conflict of interestsThe authors declare no conflict of interest.
Data availabilityThe datasets generated during the present study are not publicly available due to ethical or privacy restrictions but may be requested for reasonable reasons from the author for correspondence.
We acknowledge ADELES Gipuzkoa and Asociación de Lupus y Autoinmunes de Castilla-La Mancha for their support. We thank Dr. Carlos Saiz-Hernando for his aid in obtaining the Socioeconomic Deprivation Index of our Lupus-Cruces patients.