The relationship between depression and diabetes has been widely documented but there have been methodological limitations such as the failure to conduct a diagnostic interview of the depressive condition. We have estimated the prevalence of depression in patients with type 2 diabetes mellitus (DM2) and its relationship with sociodemographic, lifestyle and clinical variables.
Patients and methodsThis was a cross-sectional, randomized study (stratified by sex and age) of patients with DM2 treated in a healthcare area with approximately 3000 eligible patients. The depressive symptoms were assessed using the Beck Depression Inventory (depression defined as a BDI score ≥16) and a psychiatric interview. We used a multivariate logistic regression model to evaluate the association between depression and DM2, after adjusting for known risk factors.
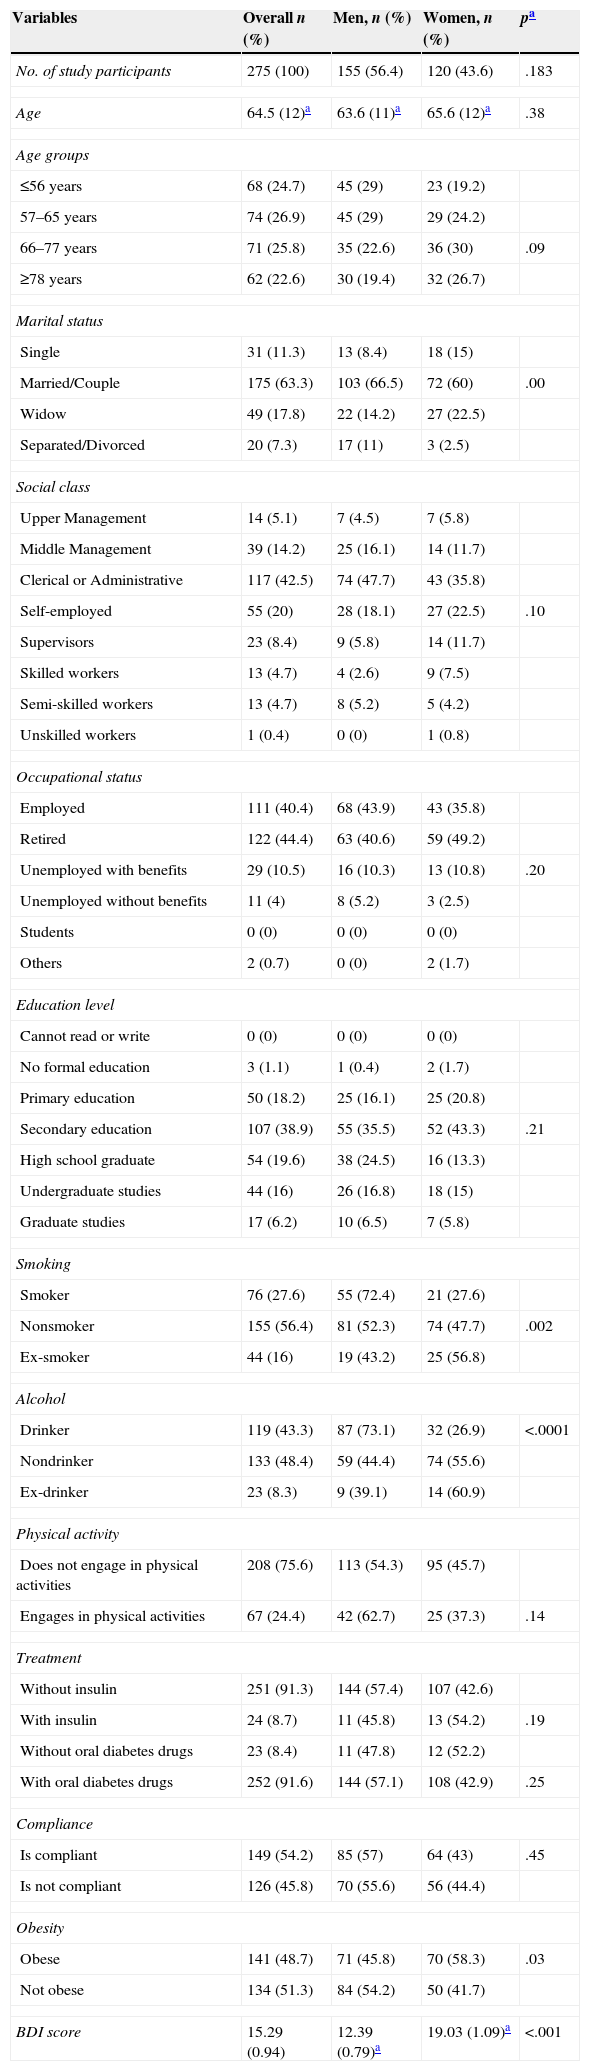
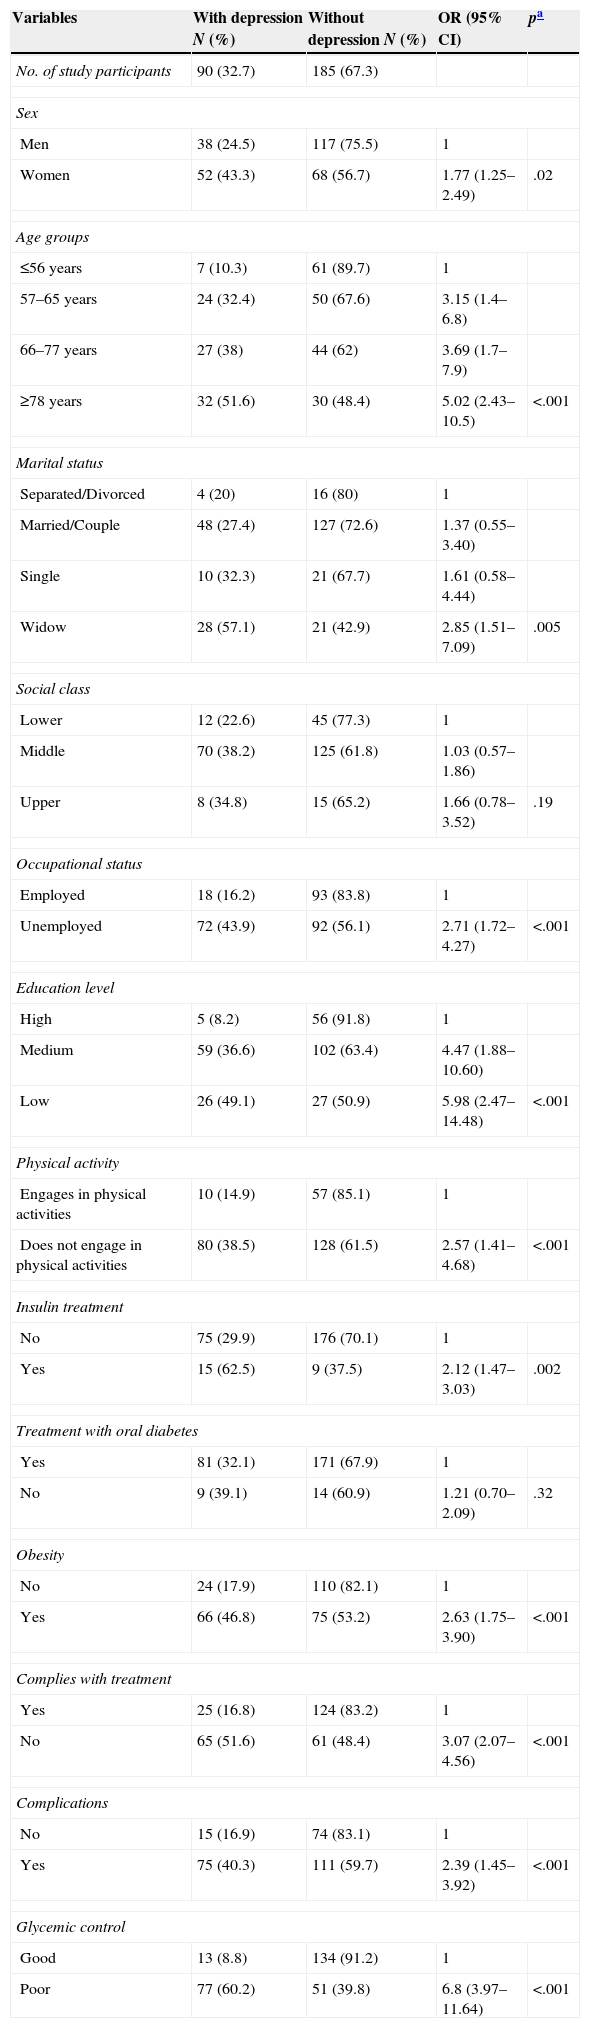
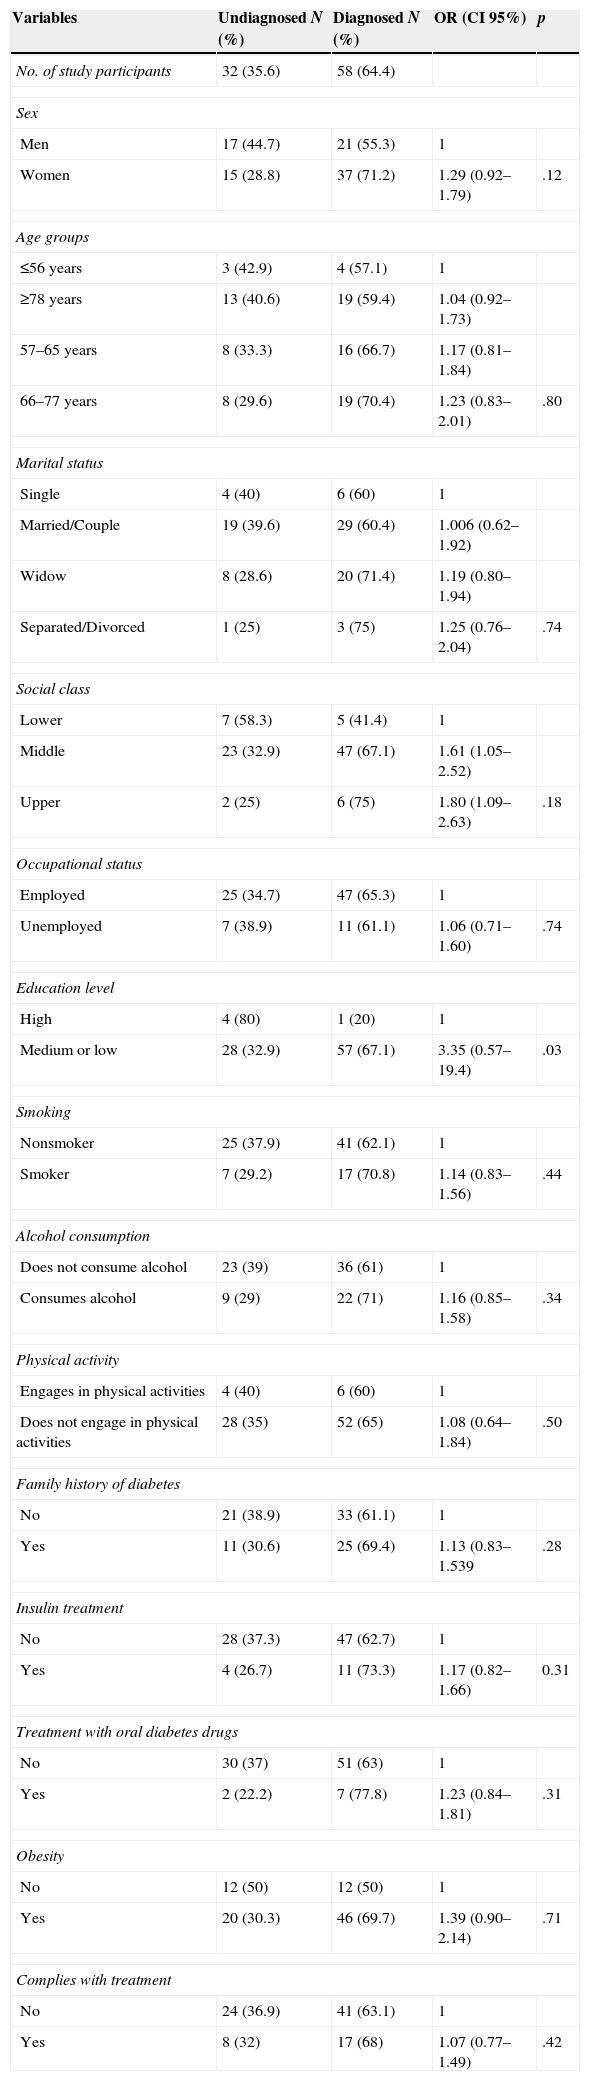
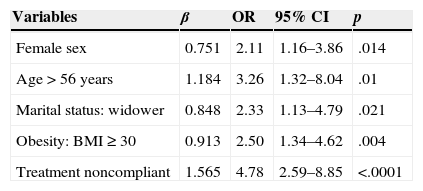
ResultsWe examined 275 patients with DM2 (mean age, 64.5 years; men, 56.4%). The prevalence of depression was calculated at 32.7% (95% CI 27.4–38.5) and increased with age. A greater prevalence of depression was found in women, widowers, patients with obesity, those with poor compliance with the prescription, those with poor glycemic control and those who developed complications from diabetes. Thirty-five percent (95% CI 26.4–45.8) of the patients who scored ≥16 on the BDI scale had not been diagnosed with depression.
ConclusionsDepression is highly prevalent in patients with DM2, especially in women. For approximately one-third of the patients, a diagnosis of depression had not been reached.
La relación entre depresión y diabetes ha sido ampliamente documentada pero con limitaciones metodológicas como la no realización de una entrevista diagnóstica del cuadro depresivo. Hemos estimado la prevalencia de depresión en pacientes con diabetes tipo 2 (DM2) y su relación con variables sociodemográficas, estilos de vida y clínicas.
Pacientes y métodosEstudio transversal, de una muestra aleatoria, estratificada por sexo y edad, de pacientes con DM2 atendidos en un área sanitaria con unos 3.000 enfermos elegibles. Los síntomas depresivos fueron evaluados mediante el Inventario de Depresión de Beck (depresión definida como BDI ≥16) y una entrevista psiquiátrica. Se utilizó un modelo de regresión logística multivariante para evaluar la asociación de la depresión con la DM2, tras ajustar por factores de riesgo conocidos.
ResultadosEstudiamos a 275 enfermos con DM2 (edad media: 64,5 años; hombres: 56,4%). La prevalencia de depresión se estimó en un 32,7% (IC 95%: 27,4–38,5) y aumentaba con la edad. Se encontró una mayor prevalencia en mujeres, en viudos, en obesos, en los malos cumplidores de la prescripción, en los que no mantenían un buen control glucémico y en los que habían desarrollado complicaciones de la diabetes. El 35% (IC 95%: 26,4–45,8) de los pacientes que obtuvieron una puntuación en la escala BDI≥16 no habían sido diagnosticados de depresión.
ConclusionesLa depresión es muy prevalente en los pacientes con DM2, especialmente en mujeres. En cerca de un tercio de los enfermos, el diagnóstico de depresión no se había formulado.
The two-way relationship between depression and diabetes has been widely documented.1,2 Depression can precede diabetes, or diabetes can promote the onset of an associated depressive condition.3–5 The complications of diabetes itself are a risk factor for the onset of depressive conditions.6,7 Patients with diabetes who experience associated depression have poorer glycemic control, a greater number and severity of complications, a poorer quality of life and higher mortality.8–10 Researching depression and diabetes in greater depth is important because they represent a significant public health problem.11
The clinical reality indicates that many of these patients are neither diagnosed nor treated.12 A multidisciplinary approach to the problem is the most appropriate treatment.13 Treatment for associated depression can improve these patients’ depressive symptoms, glycemic control and quality of life.14 Although numerous factors have been postulated regarding this greater risk of depression in patients with diabetes, most data come from cross-sectional studies, and therefore the temporal relationship between them is still not well defined.15,16 Other studies have included a limited number of participants, are not very homogeneous, have notable methodological differences, use different screening instruments or have been conducted without performing a diagnostic interview.17 Moreover, few of these studies have been population-based.18,19 The aim of our study was to estimate the prevalence of depression in patients with type 2 diabetes mellitus (DM2) in the population of Fuenlabrada and its relationship with other sociodemographic, lifestyle and clinical variables.
Patients and methodsPatients included and criteriaWe included patients with DM2 of both sexes who met the following inclusion criteria:
- •
Patients of both sexes between the ages of 29 and 85 years.
- •
Treated at the University Hospital of Fuenlabrada.
- •
Who have been diagnosed with DM2, previously or during the study period.
We excluded individuals we could not locate, those who had problems that prevented them from answering the telephone call and those who did not understand Spanish.
After correcting the potential errors in the database, the number of evaluable patients was 2281 (1298 men and 983 women). The sample size was determined by assuming a prevalence of depression associated with DM2 of 25%.17 We assumed a 95% confidence level, a power of 80% and a precision of 2%. In anticipation of study attrition, we increased the sample size by 15%. Based on these assumptions, the sample size was 321 individuals. A randomized sampling was performed, stratified by age and sex. The individuals in the sample were distributed proportionally to the population of each stratum, defined by age and sex. Of the 321 patients in the sample, 46 ultimately did not participate in the study (13 could not be located and 33 did not want to participate); therefore, a total of 275 patients were analyzed.
Data collection and diagnostic criteriaThe patients in the study sample were contacted by telephone to schedule a consultation. After determining whether they met the inclusion criteria and after obtaining their consent, the questionnaires were given to the patients. The information on the demographic variables and life habits was provided during the same interview conducted by a psychiatrist. To obtain the biological measurements, we used the patients’ medical history and the information system established by the University Hospital of Fuenlabrada. During the data analysis, we considered recoding a number of the sociodemographic and medical history variables in other dichotomous types.
The depressive disorder screening was performed using the Beck Depression Inventory (BDI), one of the most widely used instruments for assessing depressive symptoms, which has been validated for Spanish populations.20–23 Given that we already knew the patients who had been diagnosed with depressive disorder by the healthcare system and to assess the discriminative capacity of the BDI scale used to detect the patients with depression in our sample, we constructed a receiver operating characteristic curve. The cutoff of the BDI scale that jointly determines the highest sensitivity and specificity is 16 (Youden's index of 0.809), which coincides with the cutoff of other studies.24 In cases in which the BDI score was ≥16 points, the patients were scheduled in the consultation for a structured clinical assessment. To assess patient drug compliance, we used the Morisky-Green questionnaire.25 The glycated hemoglobin readings were obtained from the patient's medical history, recording the most recent values. Good glycemic control was defined as a glycated hemoglobin level ≤7.
Statistical analysisThe data were analyzed using the SPSS program v.17.0. The quantitative variables are listed as their mean, standard deviation (SD) and 95% confidence interval (95% CI). We assessed the association between qualitative variables with the chi-squared test. For ordinal variables, we contrasted the hypothesis of an ordinal trend of proportions. We calculated the odds ratio (OR) with its 95% confidence intervals (95% CI). The relationship of the quantitative variables with each of the independent variables (previously transformed into categorical variables) was analyzed using Student's t-test and/or the analysis of variance (ANOVA). We performed a backward stepwise multivariate logistic regression analysis to assess the association of those variables that were significant in the univariate analysis or that were considered clinically relevant. Statistical significance was set at p<.05. Before the start of the study, the potential participants were requested to provide their informed consent. The protocol was submitted for consideration to the Clinical Research Ethics Committee of University Hospital of Fuenlabrada.
ResultsSample characteristicsA total of 56.4% (95% CI, 50.4–62.1) of the patients were men (Table 1), and the mean age was 64.5 years (standard deviation, 11.6 years). Some 27.6% were smokers at the time of the study, a habit that was more common among the men than among the women (35% and 18%, respectively). A total of 43.3% drank alcohol (men, 73.1%), and 8.7% were on treatment with insulin. Some 88.4% were on treatment with oral diabetic drugs, and 2.9% were on treatment with insulin and oral diabetic drugs.
General characteristics of the sample of patients with diabetes.
Variables | Overall n (%) | Men, n (%) | Women, n (%) | pa |
---|---|---|---|---|
No. of study participants | 275 (100) | 155 (56.4) | 120 (43.6) | .183 |
Age | 64.5 (12)a | 63.6 (11)a | 65.6 (12)a | .38 |
Age groups | ||||
≤56 years | 68 (24.7) | 45 (29) | 23 (19.2) | |
57–65 years | 74 (26.9) | 45 (29) | 29 (24.2) | |
66–77 years | 71 (25.8) | 35 (22.6) | 36 (30) | .09 |
≥78 years | 62 (22.6) | 30 (19.4) | 32 (26.7) | |
Marital status | ||||
Single | 31 (11.3) | 13 (8.4) | 18 (15) | |
Married/Couple | 175 (63.3) | 103 (66.5) | 72 (60) | .00 |
Widow | 49 (17.8) | 22 (14.2) | 27 (22.5) | |
Separated/Divorced | 20 (7.3) | 17 (11) | 3 (2.5) | |
Social class | ||||
Upper Management | 14 (5.1) | 7 (4.5) | 7 (5.8) | |
Middle Management | 39 (14.2) | 25 (16.1) | 14 (11.7) | |
Clerical or Administrative | 117 (42.5) | 74 (47.7) | 43 (35.8) | |
Self-employed | 55 (20) | 28 (18.1) | 27 (22.5) | .10 |
Supervisors | 23 (8.4) | 9 (5.8) | 14 (11.7) | |
Skilled workers | 13 (4.7) | 4 (2.6) | 9 (7.5) | |
Semi-skilled workers | 13 (4.7) | 8 (5.2) | 5 (4.2) | |
Unskilled workers | 1 (0.4) | 0 (0) | 1 (0.8) | |
Occupational status | ||||
Employed | 111 (40.4) | 68 (43.9) | 43 (35.8) | |
Retired | 122 (44.4) | 63 (40.6) | 59 (49.2) | |
Unemployed with benefits | 29 (10.5) | 16 (10.3) | 13 (10.8) | .20 |
Unemployed without benefits | 11 (4) | 8 (5.2) | 3 (2.5) | |
Students | 0 (0) | 0 (0) | 0 (0) | |
Others | 2 (0.7) | 0 (0) | 2 (1.7) | |
Education level | ||||
Cannot read or write | 0 (0) | 0 (0) | 0 (0) | |
No formal education | 3 (1.1) | 1 (0.4) | 2 (1.7) | |
Primary education | 50 (18.2) | 25 (16.1) | 25 (20.8) | |
Secondary education | 107 (38.9) | 55 (35.5) | 52 (43.3) | .21 |
High school graduate | 54 (19.6) | 38 (24.5) | 16 (13.3) | |
Undergraduate studies | 44 (16) | 26 (16.8) | 18 (15) | |
Graduate studies | 17 (6.2) | 10 (6.5) | 7 (5.8) | |
Smoking | ||||
Smoker | 76 (27.6) | 55 (72.4) | 21 (27.6) | |
Nonsmoker | 155 (56.4) | 81 (52.3) | 74 (47.7) | .002 |
Ex-smoker | 44 (16) | 19 (43.2) | 25 (56.8) | |
Alcohol | ||||
Drinker | 119 (43.3) | 87 (73.1) | 32 (26.9) | <.0001 |
Nondrinker | 133 (48.4) | 59 (44.4) | 74 (55.6) | |
Ex-drinker | 23 (8.3) | 9 (39.1) | 14 (60.9) | |
Physical activity | ||||
Does not engage in physical activities | 208 (75.6) | 113 (54.3) | 95 (45.7) | |
Engages in physical activities | 67 (24.4) | 42 (62.7) | 25 (37.3) | .14 |
Treatment | ||||
Without insulin | 251 (91.3) | 144 (57.4) | 107 (42.6) | |
With insulin | 24 (8.7) | 11 (45.8) | 13 (54.2) | .19 |
Without oral diabetes drugs | 23 (8.4) | 11 (47.8) | 12 (52.2) | |
With oral diabetes drugs | 252 (91.6) | 144 (57.1) | 108 (42.9) | .25 |
Compliance | ||||
Is compliant | 149 (54.2) | 85 (57) | 64 (43) | .45 |
Is not compliant | 126 (45.8) | 70 (55.6) | 56 (44.4) | |
Obesity | ||||
Obese | 141 (48.7) | 71 (45.8) | 70 (58.3) | .03 |
Not obese | 134 (51.3) | 84 (54.2) | 50 (41.7) | |
BDI score | 15.29 (0.94) | 12.39 (0.79)a | 19.03 (1.09)a | <.001 |
Overall, the study population had a mean body mass index of 30.3kg/m2 (grade 1 obesity, 29.7kg/m2 [95% CI, 27.5–31.9] in men and 31.1kg/m2 [95% CI, 27.3–34.9] in women).26 A significant increase was observed in the prevalence of obesity as age increased, which was especially notable in the women.
The mean score on the BDI scale for the women (19.03) was significantly higher than that of the men (12.39). The BDI score increased with age, both in the men and women.
Prevalence of depressionThe prevalence of depression was calculated at 32.7% (95% CI, 27.4–38.5). This rate was somewhat higher in the women (43.3% [95% CI, 43.8–52.3]) than in the men (24.6% [95% CI, 18.4–31.8]) (Table 2). A significant increase was observed in the prevalence of depression as age increased (Fig. 1). The marital status with the highest prevalence of depression was widowers. In all marital statuses, the prevalence of depression was higher in the women, except for divorces, in which the rate was higher for the men. The risk of experiencing depression was 2.7 times higher among the participants who did not work, which in this case was also higher among the women. The prevalence of depression increased in inverse proportion with the level of education, with a 5-fold lower risk among the participants with university studies.
Prevalence of depression and demographic, lifestyle and medical history characteristics.
Variables | With depression N (%) | Without depression N (%) | OR (95% CI) | pa |
---|---|---|---|---|
No. of study participants | 90 (32.7) | 185 (67.3) | ||
Sex | ||||
Men | 38 (24.5) | 117 (75.5) | 1 | |
Women | 52 (43.3) | 68 (56.7) | 1.77 (1.25–2.49) | .02 |
Age groups | ||||
≤56 years | 7 (10.3) | 61 (89.7) | 1 | |
57–65 years | 24 (32.4) | 50 (67.6) | 3.15 (1.4–6.8) | |
66–77 years | 27 (38) | 44 (62) | 3.69 (1.7–7.9) | |
≥78 years | 32 (51.6) | 30 (48.4) | 5.02 (2.43–10.5) | <.001 |
Marital status | ||||
Separated/Divorced | 4 (20) | 16 (80) | 1 | |
Married/Couple | 48 (27.4) | 127 (72.6) | 1.37 (0.55–3.40) | |
Single | 10 (32.3) | 21 (67.7) | 1.61 (0.58–4.44) | |
Widow | 28 (57.1) | 21 (42.9) | 2.85 (1.51–7.09) | .005 |
Social class | ||||
Lower | 12 (22.6) | 45 (77.3) | 1 | |
Middle | 70 (38.2) | 125 (61.8) | 1.03 (0.57–1.86) | |
Upper | 8 (34.8) | 15 (65.2) | 1.66 (0.78–3.52) | .19 |
Occupational status | ||||
Employed | 18 (16.2) | 93 (83.8) | 1 | |
Unemployed | 72 (43.9) | 92 (56.1) | 2.71 (1.72–4.27) | <.001 |
Education level | ||||
High | 5 (8.2) | 56 (91.8) | 1 | |
Medium | 59 (36.6) | 102 (63.4) | 4.47 (1.88–10.60) | |
Low | 26 (49.1) | 27 (50.9) | 5.98 (2.47–14.48) | <.001 |
Physical activity | ||||
Engages in physical activities | 10 (14.9) | 57 (85.1) | 1 | |
Does not engage in physical activities | 80 (38.5) | 128 (61.5) | 2.57 (1.41–4.68) | <.001 |
Insulin treatment | ||||
No | 75 (29.9) | 176 (70.1) | 1 | |
Yes | 15 (62.5) | 9 (37.5) | 2.12 (1.47–3.03) | .002 |
Treatment with oral diabetes | ||||
Yes | 81 (32.1) | 171 (67.9) | 1 | |
No | 9 (39.1) | 14 (60.9) | 1.21 (0.70–2.09) | .32 |
Obesity | ||||
No | 24 (17.9) | 110 (82.1) | 1 | |
Yes | 66 (46.8) | 75 (53.2) | 2.63 (1.75–3.90) | <.001 |
Complies with treatment | ||||
Yes | 25 (16.8) | 124 (83.2) | 1 | |
No | 65 (51.6) | 61 (48.4) | 3.07 (2.07–4.56) | <.001 |
Complications | ||||
No | 15 (16.9) | 74 (83.1) | 1 | |
Yes | 75 (40.3) | 111 (59.7) | 2.39 (1.45–3.92) | <.001 |
Glycemic control | ||||
Good | 13 (8.8) | 134 (91.2) | 1 | |
Poor | 77 (60.2) | 51 (39.8) | 6.8 (3.97–11.64) | <.001 |
The lifestyle factors associated with a greater prevalence of depression include not performing physical activities, with a 2.5-fold greater risk in this group than in those who performed physical activities. The prevalence of depression was significantly higher in the patient group on treatment with insulin. Obesity was associated with a 2.6-fold greater risk, which was more pronounced in the women. Poor compliance tripled the risk of depression, which was also more pronounced in the women. The prevalence of depression was 2.4-fold greater in the patient group with diabetic complications compared with the group with no complications (40.3% vs. 17%, p<.05). The time from the diabetes diagnosis in the patient group with depression was statistically significant (18.9 years [95% CI, 11.7–26.3]), while for the patient group without depression, this period was 13.0 years (95% CI, 6.5–19.5).
Diagnosis of depressionAs can be seen in Table 3, 35% (95% CI 26.4–45.8) of the patients who had a BDI score ≥16 had not been diagnosed with depression. The women had been diagnosed more frequently than the men (71.2% vs. 55.3%). Depression was diagnosed less often in the participants who were single, those who had a low social class and those with a high education level. The condition is diagnosed more often as age increases and in smokers, drinkers, individuals who have sedentary lifestyles, individuals with a family history of diabetes, those undergoing treatment with oral diabetes drugs or insulin, people with obesity and those who state that they are in good compliance with the prescription.
Patients with BDI scores≥16 previously diagnosed or not with depression.
Variables | Undiagnosed N (%) | Diagnosed N (%) | OR (CI 95%) | p |
---|---|---|---|---|
No. of study participants | 32 (35.6) | 58 (64.4) | ||
Sex | ||||
Men | 17 (44.7) | 21 (55.3) | 1 | |
Women | 15 (28.8) | 37 (71.2) | 1.29 (0.92–1.79) | .12 |
Age groups | ||||
≤56 years | 3 (42.9) | 4 (57.1) | 1 | |
≥78 years | 13 (40.6) | 19 (59.4) | 1.04 (0.92–1.73) | |
57–65 years | 8 (33.3) | 16 (66.7) | 1.17 (0.81–1.84) | |
66–77 years | 8 (29.6) | 19 (70.4) | 1.23 (0.83–2.01) | .80 |
Marital status | ||||
Single | 4 (40) | 6 (60) | 1 | |
Married/Couple | 19 (39.6) | 29 (60.4) | 1.006 (0.62–1.92) | |
Widow | 8 (28.6) | 20 (71.4) | 1.19 (0.80–1.94) | |
Separated/Divorced | 1 (25) | 3 (75) | 1.25 (0.76–2.04) | .74 |
Social class | ||||
Lower | 7 (58.3) | 5 (41.4) | 1 | |
Middle | 23 (32.9) | 47 (67.1) | 1.61 (1.05–2.52) | |
Upper | 2 (25) | 6 (75) | 1.80 (1.09–2.63) | .18 |
Occupational status | ||||
Employed | 25 (34.7) | 47 (65.3) | 1 | |
Unemployed | 7 (38.9) | 11 (61.1) | 1.06 (0.71–1.60) | .74 |
Education level | ||||
High | 4 (80) | 1 (20) | 1 | |
Medium or low | 28 (32.9) | 57 (67.1) | 3.35 (0.57–19.4) | .03 |
Smoking | ||||
Nonsmoker | 25 (37.9) | 41 (62.1) | 1 | |
Smoker | 7 (29.2) | 17 (70.8) | 1.14 (0.83–1.56) | .44 |
Alcohol consumption | ||||
Does not consume alcohol | 23 (39) | 36 (61) | 1 | |
Consumes alcohol | 9 (29) | 22 (71) | 1.16 (0.85–1.58) | .34 |
Physical activity | ||||
Engages in physical activities | 4 (40) | 6 (60) | 1 | |
Does not engage in physical activities | 28 (35) | 52 (65) | 1.08 (0.64–1.84) | .50 |
Family history of diabetes | ||||
No | 21 (38.9) | 33 (61.1) | 1 | |
Yes | 11 (30.6) | 25 (69.4) | 1.13 (0.83–1.539 | .28 |
Insulin treatment | ||||
No | 28 (37.3) | 47 (62.7) | 1 | |
Yes | 4 (26.7) | 11 (73.3) | 1.17 (0.82–1.66) | 0.31 |
Treatment with oral diabetes drugs | ||||
No | 30 (37) | 51 (63) | 1 | |
Yes | 2 (22.2) | 7 (77.8) | 1.23 (0.84–1.81) | .31 |
Obesity | ||||
No | 12 (50) | 12 (50) | 1 | |
Yes | 20 (30.3) | 46 (69.7) | 1.39 (0.90–2.14) | .71 |
Complies with treatment | ||||
No | 24 (36.9) | 41 (63.1) | 1 | |
Yes | 8 (32) | 17 (68) | 1.07 (0.77–1.49) | .42 |
Some 91.8% of patients who had been diagnosed with depression were on treatment with psychoactive drugs, and 14.8% were in psychotherapy. The multivariate analysis indicated that the prevalence of depression is related to sex (greater in women), age (increasing prevalence with increasing age), marital status (greater in widowers than in other marital statuses), obesity (greater in patients with diabetes with BMI≥30), and treatment compliance (greater in those who are noncompliant) (Table 4).
Multivariate analysis of the sociodemographic and lifestyle determinants of depression in patients with diabetes.
Variables | β | OR | 95% CI | p |
---|---|---|---|---|
Female sex | 0.751 | 2.11 | 1.16–3.86 | .014 |
Age>56 years | 1.184 | 3.26 | 1.32–8.04 | .01 |
Marital status: widower | 0.848 | 2.33 | 1.13–4.79 | .021 |
Obesity: BMI≥30 | 0.913 | 2.50 | 1.34–4.62 | .004 |
Treatment noncompliant | 1.565 | 4.78 | 2.59–8.85 | <.0001 |
The finding of a 32.7% rate of depression in the patient population with DM2 in Fuenlabrada should lead us to consider this association as a relevant health problem. It is difficult to compare the prevalence in our study with those of other studies due to the differences in design, diagnostic methods, cutoff points, age groups, etc. However, our results have a good correlation with the literature.
It is important to mention 3 metaanalyses published in recent years. The first, published by Anderson, collected data from 42 studies and found a prevalence of 28% in women and 18% in men. The mean prevalence in the studies that used self-administered scales is greater (28.6%) than the prevalence found when using diagnostic interviews (22.6%), considered as the gold standard.27 The systematic review published by Ali et al. included a total of 51,331 patients and found a prevalence of 17.6%, also greater in women (23.8%) than in men (12.8%).17 The study by Roy and Lloyd (2012) reviewed 20 studies and found prevalence rates between 17.8% and 39%.28 In Spain, Jonge et al. used the Automated Geriatric Examination for Computer Assisted Taxonomy interviews with a total of 4803 participants older than 55 years who were previously diagnosed with DM2. The study found a prevalence of 15.4%.19
The prevalence in our study is located in an intermediate position and increased as age increased. This increase was greater in women (Fig. 1), which is consistent with other studies.27 The magnitude of the association is especially higher in women than in men (43.3% vs. 24.6%), although the depressive disorder is also more common in women in the general population. Similar to other studies, the prevalence was greater in widowers, in patients with low educational levels, those with obesity, those who had no work, those who did not perform physical activities, those who had poor compliance with the prescription and those who were on treatment with insulin.29 It is noteworthy that the number of patients with DM2 belonging to the unskilled worker group and the group with no education in the sample differed from the national population pattern in their age group.
Patients with poor glycemic control have at least a 4-fold greater risk of experiencing depression than those who have good control. Several studies have confirmed the association between poor glycemic control and the risk of depression in patients with diabetes; however, the direction of this association is not clear.9,10
Thirty-five percent of the patients with BDI≥16 had not been diagnosed with depression, which occurred more often in men (45%) than in women (29%). Several factors contribute to the failure in recognizing depression in diabetes. A low mood can be categorized as normal without reaching a planning stage for treatment.
The limitations of the study include the fact that a selection bias could have occurred due to the voluntary nature of the participation. A classification bias could also have occurred in the information recorded on the lifestyle-related variables, given that the information was recorded directly from the participants’ statements. Another possible limitation could be the use of the BDI scale in a population with a mean age close to 65 years and the lack of a control group. Moreover, the local nature of the study could also represent a limitation. Prospective, population-based studies are needed to understand the role of the various factors involved in the association between depression and diabetes.30
Our results confirm the growing prevalence of depression in DM2. The high proportion of undiagnosed depression and its impact on health results justify the current recommendation of performing a systematic psychosocial evaluation in the population with diabetes, using an appropriate instrument.31 The present study suggests the prioritization of depression screening in certain high-risk patient subgroups with diabetes (women, elderly patients, progressed diabetes or poor compliers), following the recommendations of American Diabetes Association.
Depression is a common complication for the patients with type 2 diabetes mellitus. However, there are few population studies that have used strict methodologies for establishing the diagnosis of depression.
What this article provides?Thirty-three percent of patients with type 2 diabetes mellitus experience depression. The depression was associated with the female sex, widowhood, obesity and the onset of complications from type 2 diabetes mellitus. A third of the patients with type 2 diabetes mellitus had not been diagnosed with depression until the implementation of this study.
The Editors
The authors declare that they have no conflicts of interest.
Please cite this article as: Rodríguez Calvín JL, Zapatero Gaviria A, Martín Ríos MD. Prevalencia de la depresión en la diabetes mellitus tipo 2. Rev Clin Esp. 2015;215:156–164.