


Transferring the results from clinical trials on type 2 diabetes prevention is the objective of the Diabetes in Europe-Prevention using Lifestyle, Physical Activity and Nutritional intervention (DE-PLAN) project in Catalonia, whose cost-effectiveness analysis is now presented.
Patients and methodsA prospective cohort study was performed in primary care involving individuals without diagnosed diabetes aged 45–75 years (n=2054) screened using the questionnaire Finnish Diabetes Risk Score (FINDRISC) and a subsequent oral glucose tolerance test. Where feasible, high-risk individuals who were identified (n=552) were allocated sequentially to standard care (n=219), a group-based (n=230) or an individual-level (n=103) intensive (structured programme of 6h using specific teaching techniques) lifestyle intervention (n=333). The primary outcome was the development of diabetes (WHO). We evaluated the cost of resources used with comparison of standard care and the intervention groups in terms of effectiveness and quality of life (15D questionnaire).
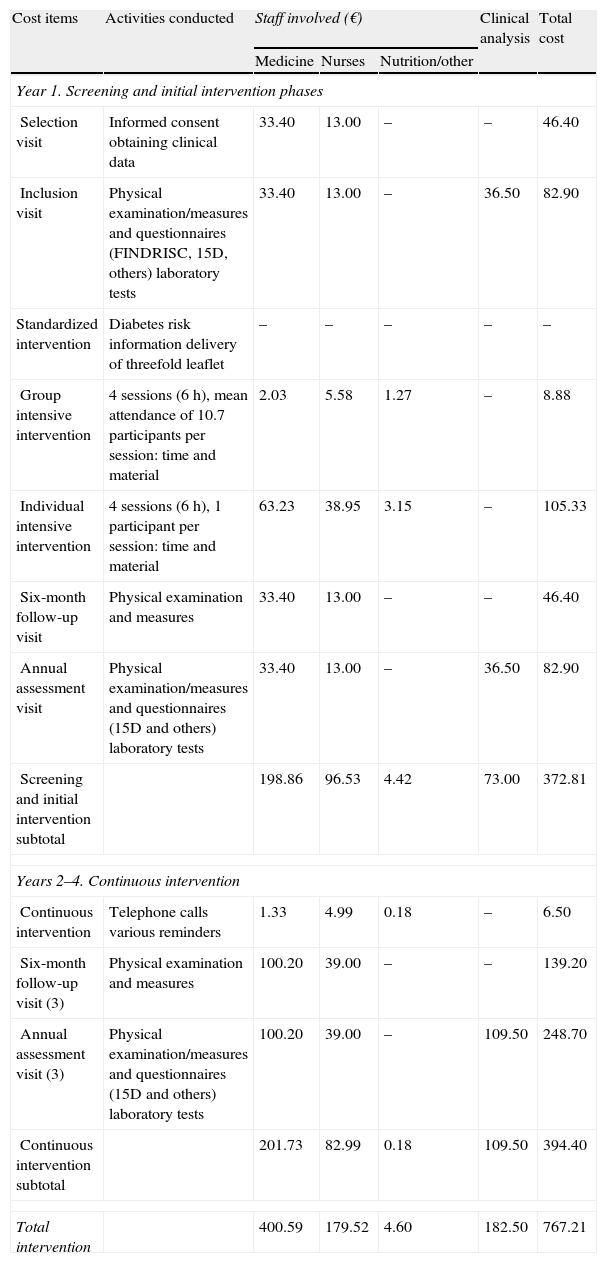
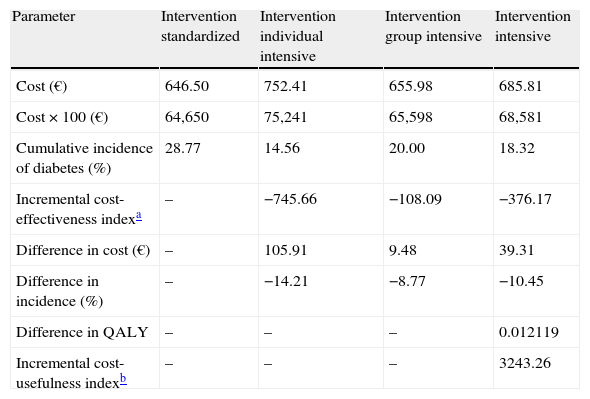
ResultsAfter 4.2-year median follow-up, the cumulative incidences were 18.3% (14.3–22.9%) in the intensive intervention group and 28.8% (22.9–35.3%) in the standard care group (36.5% relative-risk-reduction). The corresponding 4-year HR was 0.64 (0.47–0.87; P<.004). The incremental cost induced by intensive intervention compared with the standard was 106€ per participant in the individual level and 10€ in the group-based intervention representing 746€ and 108€ per averted case of diabetes, respectively. The estimated incremental cost-utility ratio was 3243€ per quality-adjusted life-years gained.
ConclusionThe intensive lifestyle intervention delayed the development of diabetes and was efficient in economic analysis.
Tasladar los resultados de los ensayos clínicos sobre prevención de la diabetes mellitus tipo 2 (DM2) es el objetivo del proyecto Diabetes in Europe-Prevention using Lifestyle, Physical Activity and Nutritional intervention (DE-PLAN) en Cataluña. En este trabajo se presenta un análisis de coste-efectividad de varias intervenciones para prevenir la DM2.
Pacientes y métodosEstudio prospectivo de cohortes en el ámbito de la atención primaria. Participaron 2.054 sujetos de 45-75 años sin DM2 diagnosticada (n=2.054), que rellenaron el cuestionario Finnish Diabetes Risk Score (FINDRISC) y una sobrecarga oral con glucosa. Cuando fue factible, los participantes con riesgo de DM2 (n=552) se asignaron consecutivamente a una intervención estandarizada (n=219) o bien a una intervención intensiva (programa estructurado de 6h usando técnicas didácticas específicas) sobre el estilo de vida (n=333): de forma grupal (n=230) o bien individual (n=103). El indicador primario de efectividad fue la incidencia de DM2 (criterios de la OMS), comparando los costes de recursos utilizados en cada grupo según efectividad y calidad de vida (cuestionario 15D).
ResultadosTras 4,2 años de mediana, la incidencia acumulada de DM2 fue del 18,3% (rango: 14,3-22,9%) en intervención intensiva y 28,8% (22,9-35,3%) en estandarizada (36,5% reducción-riesgo-relativo), con un HR=0,64 (0,47-0,87; p<0,004). El incremento del coste generado por la intervención intensiva respecto a la estandarizada fue de 106 € por participante en la modalidad individual y 10 € en la grupal, representando 746 y 108 € por caso evitado de diabetes, respectivamente. La intervención intensiva comportó un sobrecoste de 3.243 € por año de vida ganado, ajustado por calidad.
ConclusiónLa intervención intensiva sobre el estilo de vida demoró el desarrollo de diabetes y fue eficiente en términos económicos.
Article
Diríjase desde aquí a la web de la >>>FESEMI<<< e inicie sesión mediante el formulario que se encuentra en la barra superior, pulsando sobre el candado.
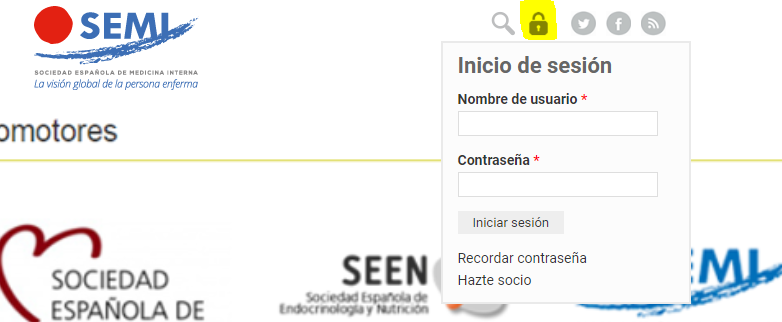
Una vez autentificado, en la misma web de FESEMI, en el menú superior, elija la opción deseada.
>>>FESEMI<<<


