
To understand the state of glycemic control of elderly patients with type 2 diabetes mellitus in Spain and its relationship with functional capacity and comorbidity.
MethodsCross-sectional, observational, multicentre national study on patients with diabetes mellitus aged 65 years or older. The study analyzed demographic and anthropometric variables, cardiovascular risk factors, clinical and laboratory data, associated comorbidity and treatments.
We analyzed the functional capacity using the Barthel index and the comorbidity with Charlson index.
ResultsThe study included 939 patients with a mean age of 76.4±6.7 years. The mean glycated hemoglobin (HbA1c) level was 7.0%±1.2%, and the mean basal blood glucose level was 137±39.6mg/dL. The HbA1c level showed statistically significant differences depending on the degree of disability. In the patients who were totally, severely, moderately or slightly dependent or who were independent, the mean HbA1c levels were 7.0%, 7.9%, 7.4% and 7.0%, respectively (p<.028). HbA1c levels were 7.3%, 7.1% and 6.9% in the patients with very high, high and medium comorbidity, respectively (p<.001).
ConclusionsMean HbA1c levels in elderly patients with type 2 diabetes analyzed in Spain are below those recommended by the main clinical practice guidelines. The levels are higher in patients who have more functional disability and a higher level of comorbidity.
Conocer el estado del control glucémico de los pacientes ancianos con diabetes mellitus tipo 2 en España y su relación con la capacidad funcional y la comorbilidad.
MétodosEstudio transversal, observacional, multicéntrico, de ámbito nacional, en pacientes con diabetes mellitus≥65 años. Se estudiaron variables sociodemográficas, antropométricas, factores de riesgo cardiovascular, datos de exploración clínica y analíticos, comorbilidad asociada y tratamientos utilizados.
Se analizó la capacidad funcional mediante el índice de Barthel y la comorbilidad con el de Charlson.
ResultadosSe incluyeron 939 pacientes. La edad media fue 76,4±6,7 años. La hemoglobina glucosilada (HbA1c) media fue 7,0±1,2% y la glucemia basal media 137±39,6mg/dl. El nivel de HbA1c presentó diferencias estadísticamente significativas según el grado de discapacidad. En los pacientes con dependencia total, grave, moderada, leve o independientes las concentraciones de HbA1c media fueron de 7,0%, 7,9%, 7,4% y 7,0% (p<0,028) respectivamente. Los niveles de HbA1c fueron de 7,3%, 7,1% y 6,9% en los pacientes con comorbilidad muy alta, alta y media, respectivamente (p<0,001).
ConclusionesLos valores medios de HbA1c en los pacientes ancianos con diabetes tipo 2 analizados en España son inferiores a los recomendados por las principales guías de práctica clínica. Son más elevados en los pacientes que presentan mayor grado de discapacidad funcional y un nivel más alto de comorbilidad.
Type 2 diabetes mellitus (DM2) is a serious health problem in most Western countries.1 Its prevalence has continuously increased in recent decades and particularly affects patients older than 65 years.2–4 As a result, various clinical guidelines and specific recommendations have been developed for treating and controlling DM2 in the elderly.5–8
According to data from the Di@bet.es study,9 the prevalence of DM2 in patients older than 65 years in Spain is between 25% and 35%, depending on the age group. The prevalence of DM2 among those older than 76 years is 20.7% in men and 23.2% in women. Among patients between 61 and 75 years of age, DM2 affects 24.8% of men and 18.7% of women.
Data analyzed by the Study Group Network for Diabetes in Primary Health Care (RedGDPS) in 2007 showed that the mean age of patients with DM2 in Spain was 68.2 years, 63% of whom were older than 65 years.10 Data published in Germany and the United States indicate a similar epidemiological situation.11,12 In 2014, the prevalence of prediabetes and DM2 among US residents 65 years of age or older was 51% and 25.9%, respectively, the latter of which represents a population of 11.2 million.13 In terms of the therapeutic approach for DM2 in patients 65 years of age or older, the Standards of Medical Care in Diabetes (recently published by the American Diabetes Association [ADA]) consider it a priority to customize treatment to meet the objectives of glycated hemoglobin (HbA1c) control.14 The ADA proposed 3 levels of control (<7.5%, <8% and <8.5%), depending on the differing degrees of disability, comorbidity and cognitive impairment.
It has also been observed that elderly patients with DM2 have a high prevalence of disability and associated comorbidities (such as arterial hypertension, coronary artery disease and cerebrovascular disease) and a high rate of geriatric syndromes (such as cognitive impairment, falls, chronic pain and polypharmacy).15 The current state of elderly patients with DM2 in Spain is unknown.
The Study of the Characteristics of Elderly Patients with Diabetes in Spain (ESCADIANE), whose results are presented in this article, was designed by the Primary Care Group of the Spanish Society of Diabetes to determine the characteristics of elderly patients with DM2 in Spain and thereby improve the healthcare strategies for this population group. The main objective of this study was to determine the state of glycemic control of elderly patients with type 2 diabetes mellitus in Spain and its relationship with functional capacity and comorbidity. The secondary objectives were to determine the prevalence of cardiovascular risk factors, determine the degree of control over these factors, determine the prevalence of macrovascular and microvascular complications, describe the treatments employed for glycemic control, analyze the percentage of patients with hypoglycemia recorded in the medical history and describe the characteristics of these patients during the year prior to the study.
Materials and methodsThis was an epidemiological, observational, cross-sectional, multicenter national study conducted between October 2014 and April 2015. Eighty-two investigators, who were primary care physicians of the various autonomous communities, participated in the study, and their distribution was proportional to the population of each autonomous community in Spain.
The study population consisted of all patients 65 years of age or older with known or newly diagnosed DM2 according to the 2011 ADA criteria16 (cardinal symptoms of diabetes and random glucose level ≥200mg/dL on one occasion; fasting blood glucose ≥126mg/dL, HbA1c≥6.5% or blood glucose≥200mg/dL 2h after an oral overload with 75g of glucose). If the presence of hyperglycemia was not unequivocal, the results were confirmed by repeating the analysis.
The patients were required to sign an informed consent document (themselves or their legal representative), and they could not be participating in any other epidemiological study.
The study excluded individuals younger than 65 years, those who did not meet the 2011 ADA diagnostic criteria for DM2, those in terminal condition and those whose medical history provided insufficient data for the study, in the assessment committee's judgment.
Each medical researcher was asked to select 12 patients with DM2 who meet the inclusion criteria. To this end, a sequence of random numbers was provided from which these patients could be chosen from the medical researcher's list of all patients with DM2 who were 65 years or older.
Study variablesWe studied the following demographic and anthropometric variables: age, sex, weight, height, body mass index, abdominal circumference, smoking (smoker, former smoker, nonsmoker), alcohol consumption (drinker, exdrinker, nondrinker), systolic and diastolic blood pressure, years of progression and date of diagnosis of diabetes mellitus.
We recorded the disease history and onset of the macrovascular and microvascular complications of DM2, with a confirmed diagnosis and date in the medical history. These complications included ischemic heart disease (angina pectoris or myocardial infarction), heart failure, cerebrovascular disease, symptomatic peripheral artery disease, kidney disease (estimated glomerular filtration rate<60mL/min/1.73m2 and/or the presence of albuminuria>30mg/24h and/or albumin/creatinine ratio in an isolated urine sample >30mg/g), neuropathy, retinopathy, dyslipidemia, arterial hypertension, left ventricular hypertrophy and cardiac arrhythmia.
The study recorded the drug treatment used routinely by the patients (antidiabetic agents, antihypertensive agents, lipid-lowering agents, antiplatelet agents or anticoagulant agents) and investigated the history of hypoglycemia in the medical history and whether external assistance was required, i.e., from another individual for recovery.
The collected analytical variables included HbA1c (%), baseline blood glucose (mg/dL), lipid profile (total cholesterol, HDL cholesterol, LDL cholesterol, triglycerides), hepatic profile, serum creatinine, estimated glomerular filtration rate according to the Modification of Diet in Renal Disease formula (mL/min/1.73m2) and the albumin/creatinine ratio in urine.
To study the level of dependence, we used the Barthel index17 and classified patients according to their scores as follows: independent (100 points), slight dependence (91–99 points), moderate dependence (61–90 points), severe dependence (21–60 points) or total dependence (0–20 points). Comorbidity, based on the Charlson index,18 helped classify the patients as follows: low comorbidity (0 points), medium comorbidity (1–2 points), high comorbidity (3–4 points) and very high comorbidity (≥5 points).
The study was classified as a “post-authorization, observational, other design study” by the Spanish Agency for Medicines (code FJS-DIA-2013-01) and approved by the Clinical Research Ethics Committee of Aragon.
Statistical analysisFor a 95% confidence level, we calculated that a sample of 939 patients would achieve a precision of 2–3%. A descriptive analysis was performed of the demographic, social, anthropometric, analytical and comorbidity variables. The continuous variables were described using measures of central tendency (mean or median), noncentral (quartiles) or dispersion (standard deviation), and the qualitative variables were expressed using absolute and relative frequency distributions (percentages).
To compare the quantitative variables against the qualitative variables, we checked (using the Kolmogorov–Smirnov test) whether the quantitative variables followed a normal distribution. We used parametric (Student's t-test or ANOVA) or nonparametric (Mann–Whitney U test or Kruskal–Wallis test) tests depending on whether normality was met.
Differences between proportions were calculated using the chi-squared test.
When necessary, we used the Yates correction. In the event that multiple comparisons needed to be performed, we applied the Bonferroni method. A significance level of p<.05 was assumed, and the statistical analysis was performed using the IBM SPSS Statistics Software v.23.
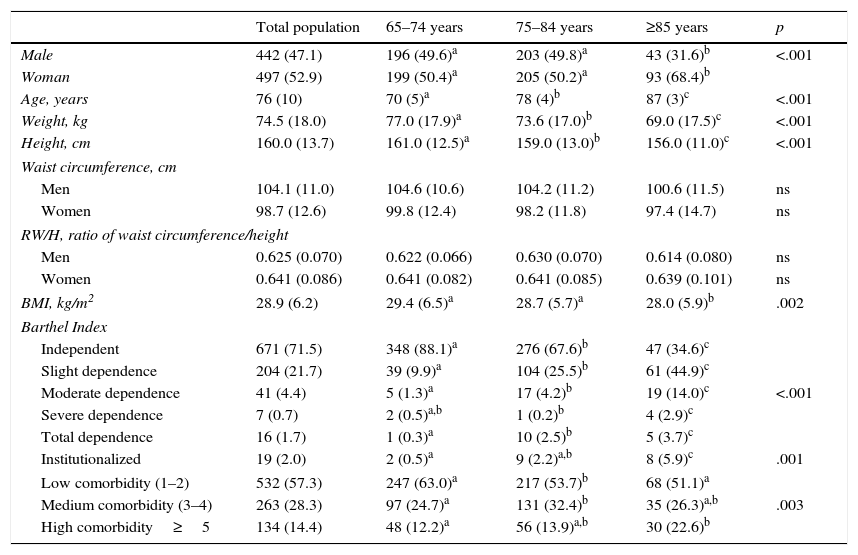
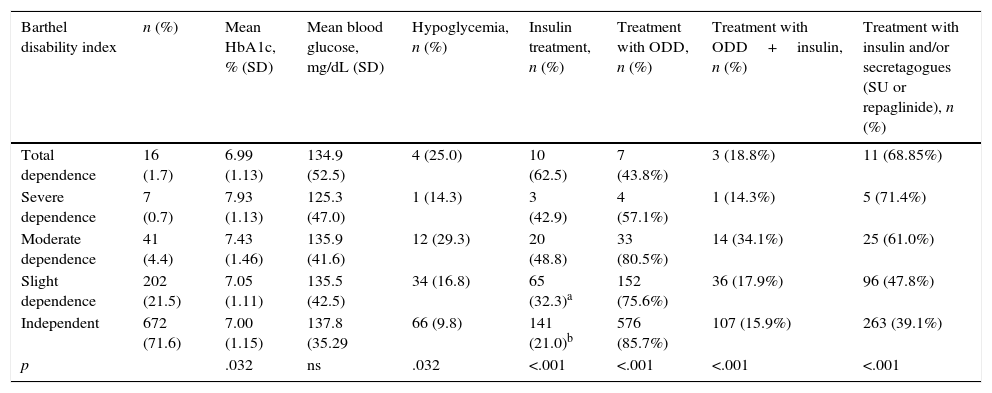
ResultsThe study included 939 patients, whose mean age was 76.4±6.7 years. The values for the anthropometric variables, functional capacity and comorbidity distributed by age group are shown in Table 1. The results of the degree of glycemic control, baseline fasting glucose and the rate of hypoglycemia according to the degree of dependence and comorbidity are shown in Table 2. The HbA1c level showed statistically significant differences based on the degree of disability between the elderly patients with DM2 and severe dependence and those who were independent (p=.01) or had slight dependence (p=.03). The patients with severe dependence had a higher mean HbA1c level (7.9±1.1%). There was also a significant difference between the mean HbA1c level of the elderly patients with diabetes and moderate dependence versus those who were independent (7.43% vs. 7, p=.047). A high percentage of the patients with total dependence (62.5%) were undergoing insulin treatment.
Anthropometric measures functional capacity and comorbidity of the study population.
| Total population | 65–74 years | 75–84 years | ≥85 years | p | |
|---|---|---|---|---|---|
| Male | 442 (47.1) | 196 (49.6)a | 203 (49.8)a | 43 (31.6)b | <.001 |
| Woman | 497 (52.9) | 199 (50.4)a | 205 (50.2)a | 93 (68.4)b | |
| Age, years | 76 (10) | 70 (5)a | 78 (4)b | 87 (3)c | <.001 |
| Weight, kg | 74.5 (18.0) | 77.0 (17.9)a | 73.6 (17.0)b | 69.0 (17.5)c | <.001 |
| Height, cm | 160.0 (13.7) | 161.0 (12.5)a | 159.0 (13.0)b | 156.0 (11.0)c | <.001 |
| Waist circumference, cm | |||||
| Men | 104.1 (11.0) | 104.6 (10.6) | 104.2 (11.2) | 100.6 (11.5) | ns |
| Women | 98.7 (12.6) | 99.8 (12.4) | 98.2 (11.8) | 97.4 (14.7) | ns |
| RW/H, ratio of waist circumference/height | |||||
| Men | 0.625 (0.070) | 0.622 (0.066) | 0.630 (0.070) | 0.614 (0.080) | ns |
| Women | 0.641 (0.086) | 0.641 (0.082) | 0.641 (0.085) | 0.639 (0.101) | ns |
| BMI, kg/m2 | 28.9 (6.2) | 29.4 (6.5)a | 28.7 (5.7)a | 28.0 (5.9)b | .002 |
| Barthel Index | |||||
| Independent | 671 (71.5) | 348 (88.1)a | 276 (67.6)b | 47 (34.6)c | <.001 |
| Slight dependence | 204 (21.7) | 39 (9.9)a | 104 (25.5)b | 61 (44.9)c | |
| Moderate dependence | 41 (4.4) | 5 (1.3)a | 17 (4.2)b | 19 (14.0)c | |
| Severe dependence | 7 (0.7) | 2 (0.5)a,b | 1 (0.2)b | 4 (2.9)c | |
| Total dependence | 16 (1.7) | 1 (0.3)a | 10 (2.5)b | 5 (3.7)c | |
| Institutionalized | 19 (2.0) | 2 (0.5)a | 9 (2.2)a,b | 8 (5.9)c | .001 |
| Low comorbidity (1–2) | 532 (57.3) | 247 (63.0)a | 217 (53.7)b | 68 (51.1)a | .003 |
| Medium comorbidity (3–4) | 263 (28.3) | 97 (24.7)a | 131 (32.4)b | 35 (26.3)a,b | |
| High comorbidity≥5 | 134 (14.4) | 48 (12.2)a | 56 (13.9)a,b | 30 (22.6)b | |
The data are expressed as mean (SD), median (IR) or number (%) as necessary.
For qualitative variables (n [%]): Chi-squared test p-value. For quantitative variables: parametric test (Student's t-test or one-factor ANOVA) if they follow a normal distribution, nonparametric test (Mann–Whitney U test, Kruskal–Wallis K test) if they do not follow a normal distribution.
Abbreviations: SD, standard deviation; BMI, body mass index; ns, not significant; IR, interquartile range.
a,b,c The superscript letters indicate a subgroup of age groups; categories whose column proportions do not differ significantly from each other at the 0.05 level.
Relationship between the degree of disability and comorbidity and glycemic control.
| Barthel disability index | n (%) | Mean HbA1c, % (SD) | Mean blood glucose, mg/dL (SD) | Hypoglycemia, n (%) | Insulin treatment, n (%) | Treatment with ODD, n (%) | Treatment with ODD+insulin, n (%) | Treatment with insulin and/or secretagogues (SU or repaglinide), n (%) |
|---|---|---|---|---|---|---|---|---|
| Total dependence | 16 (1.7) | 6.99 (1.13) | 134.9 (52.5) | 4 (25.0) | 10 (62.5) | 7 (43.8%) | 3 (18.8%) | 11 (68.85%) |
| Severe dependence | 7 (0.7) | 7.93 (1.13) | 125.3 (47.0) | 1 (14.3) | 3 (42.9) | 4 (57.1%) | 1 (14.3%) | 5 (71.4%) |
| Moderate dependence | 41 (4.4) | 7.43 (1.46) | 135.9 (41.6) | 12 (29.3) | 20 (48.8) | 33 (80.5%) | 14 (34.1%) | 25 (61.0%) |
| Slight dependence | 202 (21.5) | 7.05 (1.11) | 135.5 (42.5) | 34 (16.8) | 65 (32.3)a | 152 (75.6%) | 36 (17.9%) | 96 (47.8%) |
| Independent | 672 (71.6) | 7.00 (1.15) | 137.8 (35.29 | 66 (9.8) | 141 (21.0)b | 576 (85.7%) | 107 (15.9%) | 263 (39.1%) |
| p | .032 | ns | .032 | <.001 | <.001 | <.001 | <.001 |
| Charlson Comorbidity Index | n (%) | HbA1c, % | Glycemia, mg/dL | Hypoglycemia, n (%) | Insulin treatment | ODD treatment | Treatment with ODD+insulin, n (%) | Treatment with insulin and/or secretagogues |
|---|---|---|---|---|---|---|---|---|
| Medium comorbidity: 1–2 | 535 (57.3) | 6.95 (1.08) | 136.34 (36.77) | 48 (41.0)a | 88 (16.4%) | 473 (88.2%) | 70 (13.1%) | 194 (36.2%) |
| High comorbidity: 3–4 | 265 (28.3) | 7.06 (1.16) | 136.90 (40.50) | 32 (27.4)a | 83 (31.4%) | 210 (79.5%) | 61 (23.1%) | 120 (45.5%) |
| Very high comorbidity ≥5 | 134 (14.4) | 7.31 (1.37) | 140.99 (48.18) | 37 (31.6)b | 68 (50.7%) | 87 (64.9%) | 30 (22.4%) | 85 (63.4%) |
| p | .012 | ns | .012 | <.001 | <.001 | <.001 | <.001 |
Abbreviations: ODD, oral diabetes drugs; SD, standard deviation; SU, sulfonylureas.
a,b The superscript letters indicate a subgroup of age groups; categories whose column proportions do not differ significantly from each other at the 0.05 level.
According to the Charlson index, 57.2% of the elderly with DM2 had medium comorbidity (score 1–2), 28.4% had high comorbidity (3–4), and 14.4% had very high comorbidity (≥5).
The HbA1c levels increased as the comorbidity increased, with statistically significant differences between the HbA1c readings of the elderly patients with DM2 and medium comorbidity versus those with very high comorbidity (p=.012) (Table 2). As the comorbidity increased, the percentage of patients treated with insulin alone or combined with secretagogues increased, while the percentage of patients treated with oral diabetes drugs decreased.
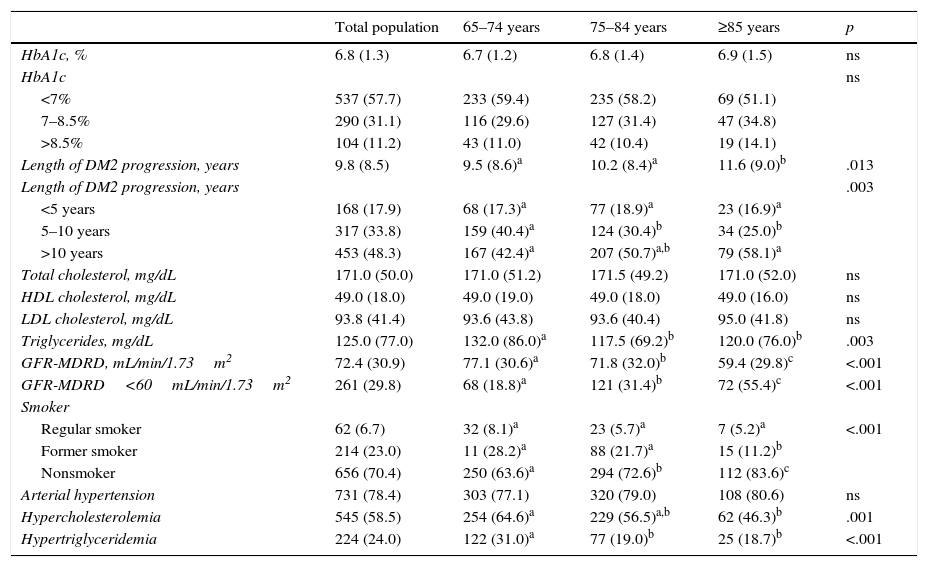
Table 3 shows the data for the glycemic control and prevalence of cardiovascular risk factors. Forty percent of the patients had a body mass index>30, 43.7% had systolic blood pressure readings>140mmHg and/or diastolic readings>90mmHg. Only 3.2% of the patients had total cholesterol readings>250mg/dL. Some 84.3% of the patients without cardiovascular disease had LDL cholesterol levels<130mg/dL. In 69.1% of those who had prior cardiovascular disease, the LDL cholesterol levels were<100mg/dL. The HDL cholesterol levels were appropriate in 60.7% of the patients (HDL>50mg/dL in women and >40mg/dL in men), and 66.6% of the patients maintained triglycerides levels <150mg/dL. LDL cholesterol levels were <70mg/dL in 34% of the patients with macrovascular disease and in 24.1% of the patients with advanced renal failure.
Glycemic control and cardiovascular risk factors in the study population.
| Total population | 65–74 years | 75–84 years | ≥85 years | p | |
|---|---|---|---|---|---|
| HbA1c, % | 6.8 (1.3) | 6.7 (1.2) | 6.8 (1.4) | 6.9 (1.5) | ns |
| HbA1c | ns | ||||
| <7% | 537 (57.7) | 233 (59.4) | 235 (58.2) | 69 (51.1) | |
| 7–8.5% | 290 (31.1) | 116 (29.6) | 127 (31.4) | 47 (34.8) | |
| >8.5% | 104 (11.2) | 43 (11.0) | 42 (10.4) | 19 (14.1) | |
| Length of DM2 progression, years | 9.8 (8.5) | 9.5 (8.6)a | 10.2 (8.4)a | 11.6 (9.0)b | .013 |
| Length of DM2 progression, years | .003 | ||||
| <5 years | 168 (17.9) | 68 (17.3)a | 77 (18.9)a | 23 (16.9)a | |
| 5–10 years | 317 (33.8) | 159 (40.4)a | 124 (30.4)b | 34 (25.0)b | |
| >10 years | 453 (48.3) | 167 (42.4)a | 207 (50.7)a,b | 79 (58.1)a | |
| Total cholesterol, mg/dL | 171.0 (50.0) | 171.0 (51.2) | 171.5 (49.2) | 171.0 (52.0) | ns |
| HDL cholesterol, mg/dL | 49.0 (18.0) | 49.0 (19.0) | 49.0 (18.0) | 49.0 (16.0) | ns |
| LDL cholesterol, mg/dL | 93.8 (41.4) | 93.6 (43.8) | 93.6 (40.4) | 95.0 (41.8) | ns |
| Triglycerides, mg/dL | 125.0 (77.0) | 132.0 (86.0)a | 117.5 (69.2)b | 120.0 (76.0)b | .003 |
| GFR-MDRD, mL/min/1.73m2 | 72.4 (30.9) | 77.1 (30.6)a | 71.8 (32.0)b | 59.4 (29.8)c | <.001 |
| GFR-MDRD<60mL/min/1.73m2 | 261 (29.8) | 68 (18.8)a | 121 (31.4)b | 72 (55.4)c | <.001 |
| Smoker | |||||
| Regular smoker | 62 (6.7) | 32 (8.1)a | 23 (5.7)a | 7 (5.2)a | <.001 |
| Former smoker | 214 (23.0) | 11 (28.2)a | 88 (21.7)a | 15 (11.2)b | |
| Nonsmoker | 656 (70.4) | 250 (63.6)a | 294 (72.6)b | 112 (83.6)c | |
| Arterial hypertension | 731 (78.4) | 303 (77.1) | 320 (79.0) | 108 (80.6) | ns |
| Hypercholesterolemia | 545 (58.5) | 254 (64.6)a | 229 (56.5)a,b | 62 (46.3)b | .001 |
| Hypertriglyceridemia | 224 (24.0) | 122 (31.0)a | 77 (19.0)b | 25 (18.7)b | <.001 |
The data are expressed as mean (SD), median (IR) or number (%) as necessary.
For qualitative variables (n [%]): Chi-squared test p-value. For quantitative variables: parametric test (Student's t-test or one-factor ANOVA) if they follow a normal distribution, nonparametric test (Mann–Whitney U test, Kruskal–Wallis K test) if they do not follow a normal distribution.
a,b,c The superscript letters indicate a subgroup of age groups; categories whose column proportions do not differ significantly from each other at the 0.05 level.
Abbreviations: DM2, type 2 diabetes mellitus; GFR-MDRD, Modification Diet in Renal Disease to calculate the glomerular filtrate rate; HbA1c, glycated hemoglobin; HDL, high-density lipoprotein; LDL, low-density lipoprotein; ns, not significant; IR, interquartile range.
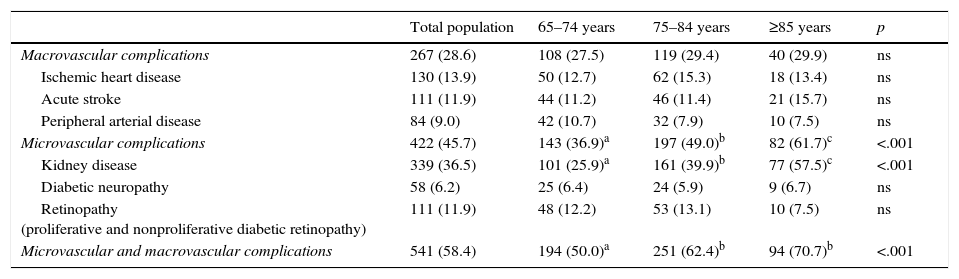
Some 58.4% of the population had macrovascular and/or microvascular complications (Table 4). Some 28.6% of the patients had at least one macrovascular disease, and 45.7% had some microvascular complication.
Macrovascular and microvascular complications in the study population and in the various age groups.
| Total population | 65–74 years | 75–84 years | ≥85 years | p | |
|---|---|---|---|---|---|
| Macrovascular complications | 267 (28.6) | 108 (27.5) | 119 (29.4) | 40 (29.9) | ns |
| Ischemic heart disease | 130 (13.9) | 50 (12.7) | 62 (15.3) | 18 (13.4) | ns |
| Acute stroke | 111 (11.9) | 44 (11.2) | 46 (11.4) | 21 (15.7) | ns |
| Peripheral arterial disease | 84 (9.0) | 42 (10.7) | 32 (7.9) | 10 (7.5) | ns |
| Microvascular complications | 422 (45.7) | 143 (36.9)a | 197 (49.0)b | 82 (61.7)c | <.001 |
| Kidney disease | 339 (36.5) | 101 (25.9)a | 161 (39.9)b | 77 (57.5)c | <.001 |
| Diabetic neuropathy | 58 (6.2) | 25 (6.4) | 24 (5.9) | 9 (6.7) | ns |
| Retinopathy (proliferative and nonproliferative diabetic retinopathy) | 111 (11.9) | 48 (12.2) | 53 (13.1) | 10 (7.5) | ns |
| Microvascular and macrovascular complications | 541 (58.4) | 194 (50.0)a | 251 (62.4)b | 94 (70.7)b | <.001 |
The data are expressed as numbers (%). For qualitative variables: p value calculated with the chi-squared test. For quantitative variables: parametric test (Student's t-test or one-factor ANOVA) if they follow a normal distribution, nonparametric test (Mann–Whitney U test, Kruskal–Wallis K test) if they do not follow a normal distribution.
Abbreviation: ns, not significant.
a,b,c The superscript letters indicate a subgroup of age groups; categories whose column proportions do not differ significantly from each other at the 0.05 level.
Ninety-one percent of the patients followed a drug therapy: 25.5% with insulin and 82% with noninsulin therapy. Seventeen percent of the patients used insulin along with oral diabetes drugs. Sixteen percent of the patients took sulfonylureas, the most common of which was gliclazide (54% of the sulfonylureas). Twenty-eight percent of the patients were treated with dipeptidyl-peptidase-4 inhibitors (DPP4i). This group of inhibitors included sitagliptin (46.5%), vildagliptin (30%) and linagliptin (19%). The most widely used oral diabetes drugs (or combinations) were metformin (47%), metformin plus DPP-4i (19%), metformin plus sulfonylureas (9), DPP4i (6%) and DPP4i plus metformin plus sulfonylureas (5%).
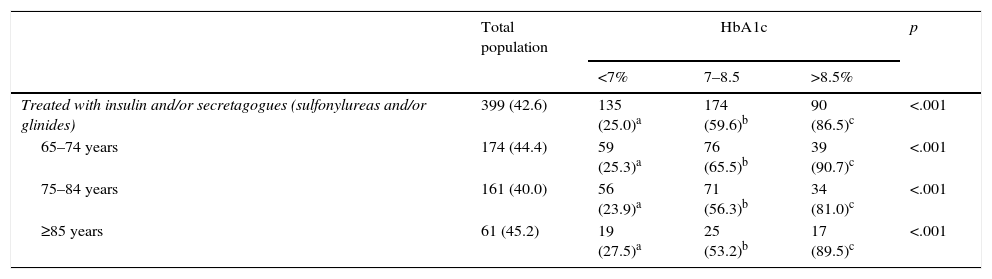
Some 12.5% of the patients had hypoglycemic episodes recorded in their medical history. Eighteen percent of these episodes were considered severe, because they required the assistance of another individual. Eighty-six percent of the severe hypoglycemic events occurred in patients treated with insulin versus 14% that occurred in patients treated with secretagogues (sulfonylureas or repaglinide). There was a higher percentage of insulin and secretagogue use among patients who had greater comorbidity and dependency. These drugs were more often used by the patients with poorer metabolic control (67% of the patients with an HbA1c level >7% were treated with insulin and/or secretagogues vs. 25% of the patients with an HbA1c level <7%) (Table 5).
Treatments used and metabolic control in the overall population and in the various age groups.
| Total population | HbA1c | p | |||
|---|---|---|---|---|---|
| <7% | 7–8.5 | >8.5% | |||
| Treated with insulin and/or secretagogues (sulfonylureas and/or glinides) | 399 (42.6) | 135 (25.0)a | 174 (59.6)b | 90 (86.5)c | <.001 |
| 65–74 years | 174 (44.4) | 59 (25.3)a | 76 (65.5)b | 39 (90.7)c | <.001 |
| 75–84 years | 161 (40.0) | 56 (23.9)a | 71 (56.3)b | 34 (81.0)c | <.001 |
| ≥85 years | 61 (45.2) | 19 (27.5)a | 25 (53.2)b | 17 (89.5)c | <.001 |
| Total population | HbA1c | p | ||
|---|---|---|---|---|
| <7% | ≥7% | |||
| Treated with insulin and/or secretagogues | 399 (42.6) | 135 (25.0)a | 264 (66.7)b | <.001 |
| 65–74 years | 174 (44.4) | 59 (25.3)a | 115 (72.3)b | <.001 |
| 75–84 years | 161 (40.0) | 56 (23.9)a | 105 (62.5)b | <.001 |
| ≥85 years | 61 (45.2) | 19 (27.5)a | 42 (63.6)b | <.001 |
The data are expressed as numbers (%).
Abbreviation: HbA1c, glycated hemoglobin.
a,b,c The superscript letters indicate a subgroup of age groups; categories whose column proportions do not differ significantly from each other at the 0.05 level.
The management of patients with DM2 requires an appropriate individual assessment to establish the control objectives and the best therapeutic strategy. Age, life expectancy, functional capacity, comorbidity, disease progression and patient collaboration are the pillars for basing the clinical decisions and establishing the objectives of glycemic control.19
For elderly patients with DM2, it is especially important to prevent hypoglycemic episodes and adverse drug effects, which can worsen the quality of life and cause falls, accidents and cognitive impairment. The strict control of metabolic parameters in these patients is less likely to provide long-term benefits,5,6,8 especially in the most elderly. Our study highlights the low HbA1c concentrations of elderly patients with DM2.
The mean HbA1c was 7%, despite the fact that these patients had a mean disease progression time of more than 10 years (11.6±7.9). Seventy-five percent of the patients had HbA1c levels <7.5%. These readings are indicative of the therapeutic intensity and could explain the reasons behind the hypoglycemic events recorded in the medical history (one of every 8 patients had experienced at least 1 episode of hypoglycemia). Of these, 18% required external assistance for their recovery.
The data on glycemic control in this study are similar to those of other studies conducted in our setting20–22 or other countries. An analysis of 1288 patients older than 65 years23 from a United States health survey (NHANES) indicated the possible overtreatment of elderly patients, given that 61.5% of the study sample had HbA1c levels <7%, and 41.9% had levels <6.5%. Another health survey performed in Germany found that 65% of patients with diabetes had HbA1c levels <7%.24
The results showed poorer glycemic control when the elderly patient with diabetes had a higher degree of comorbidity, although the difference in HbA1c levels between the groups with greater and lesser comorbidity was only 0.36%, a difference of little clinical relevance. Poorer blood glycemic control was also observed as the degree of dependence increased, except in cases of total dependence, which presented mean levels similar to the elderly patients with no degree of dependence. Strict glycemic control for completely dependent elderly patients with diabetes could be associated with the intensification of insulin therapy.
A study performed in France25 on patients older than 70 years with diabetes investigated the relationship between metabolic control and morbidity and mortality. The study evaluated 3 cohorts according to the treatment employed: insulin alone, insulin plus oral diabetes drugs and oral diabetes drugs alone and/or glucagon-like peptide-1 analogs. A high rate of hypoglycemia (53%) was observed in the first group, who also had poorer glycemic control and higher rates of retinopathy, kidney disease, cardiovascular impairment and geriatric complications. The patients treated exclusively with oral diabetes drugs or glucagon-like peptide-1 analogs had a very similar disease progression, characteristics and comorbidities to those of our sample and had similar mean HbA1c levels (7.1%), with 75% of patients with HbA1c levels <7.5%.
As was expected, the elderly patients in our sample had a high number of cardiovascular risk factors and vascular complications. Arterial hypertension, present in 78% of patients, remained the most difficult-to-control factor. Approximately one third of the elderly patients with DM2 had macrovascular disease. Like other Spanish studies,20,21,26 the main complication was ischemic heart disease (13.9%), followed by cerebrovascular disease (11.9%) and peripheral arterial disease (9%). However, the prevalence of macrovascular disease was much lower compared with that of other Western countries such as the United States,23,27 Germany,28,29 Scotland30 and France,25 even in younger cohorts.
Microvascular complications affected 45.7% of the patients, the most prevalent of which was chronic kidney disease. The high prevalence of chronic kidney disease should affect the drug therapies employed and be the subject of more studies.
In terms of drug therapy, metformin was the most frequently used drug, followed by DPP4i. The use of insulin was not residual, given that it was used in 25% of cases. Understanding how to manage its use is therefore important. Insulin and secretagogues had the closest relationship with hypoglycemia, and their use was more frequent among the patients with poorer metabolic control. It is also striking that glibenclamide still represented 7% of the sulfonylureas employed, despite its long half-life and capacity for causing hypoglycemia.
This study has limitations that are inherent in cross-sectional studies. The data were extracted from the medical history, and some of the results, such as the prevalence of hypoglycemia and geriatric syndromes, are probably underestimated. However, the size of the study sample and patient selection method (with researchers distributed throughout Spain, using a series of random numbers to select patients) leads us to believe that the results are representative of the current situation in Spain.
ConclusionMean HbA1c levels in elderly patients with DM2 analyzed in Spain are below those recommended by the main clinical practice guidelines. These values are higher in the patients with a higher level of comorbidity and were influenced by the patient's degree of disability.
FundingThis study was made possible thanks to financial support by Boehringer-Ingelheim. The financial sources had no role in designing the study, collecting the data or interpreting the data. The financial sources also did not participate in the preparation, review or approval of the manuscript.
Conflict of interestsThe authors declare that they have no conflicts of interest.
The authors would like to thank Daniel Bordonaba Bosque of the Aragon Institute of Health Sciences for the statistical treatment of the data.
The authors would also like to thank Dr. F. Javier Toledo Pallarés for correcting the abstract.
Lastly, the authors would like to thank the researchers of the ESCADIANE study throughout Spain:
Andalusia: M.D. Acosta González, L. Ávila Lachica, M.S. Cano García, E. Carretero Anibarro, S. Cobo Burgos, G. Fábrega Escolá, M. Fernández Baena, M.J. García Lozano, M. Garrido Redondo, L. Ginel Mendoza, M.C. Gómez García, A.M. Iranzo Luna, C. Losada Ruiz, G. Martín Montero, E. Requena Carrión, J. Pérez Verdugo, M. Ruiz Serrano, J. Vergara Martín, L. Velázquez Lupiáñez.
Aragon: R. Ariza Ortín, L. Canta Castro, B. Chicote Abadía, P. Gil Orna, M.M. Gracia Tricas, M.S. Rascón Velázquez, F.J. Sangrós González, G. Sanz Rebollo, J. Torrecilla Conde, J.M. Millaruelo Trillo.
Balearic Islands: E. Angullo Martínez, M. Segui Díaz.
Canary Islands: S.M. Álvarez Hernández, L. Carrillo Fernández, J.A. Fernández.
Cantabria: J.M. Arnaiz de las Revillas.
Castilla y León: J. Gamarra Ortiz, L.G. Sánchez Cabrero, M.A. Gutiérrez Almarza.
Castilla La Mancha: L. Gómez González.
Catalonia: J. Barrot de la Puente, B. Benito Badorrey, I. Bobe Molina, G. Cuatrecasas Cambra, J. Franch Nadal, M. Hidalgo Ortiz, G. Luna Redondo, M. Mata Cases, T. Mur Martí, M.A. Navarro Echeverría, P. Prats de la Iglesia, M. Rodero Nuño, I. Ruiz Tamayo.
Extremadura: F. Carramiñana Barrera, D. Igual Fraile.
Galicia: F.J. García Soidán, F. Malo García, A. Martínez Vidal.
La Rioja: C. Babace Istúriz, J.L. Torres Baile.
Madrid: S. Artola Menéndez, M.J. Bedoya Frutos, M.G. García Caro, M. Ibañez Brillas, R. López Palomar, P. Nogales Aguado, M.T. Rollán Landeras, C. Sala Arnaiz, R. Serrano Martín, M. Yanes Baonza.
Murcia: B. Álvarez García, E. Granero Fernández, F. Hernández Menarguez, J. Martínez Candela.
Navarra: L. Astrain Jaunsaras, P. Buil Cosiales, J. Díez Espino, L. Escriche Erviti, E. Fernández Clavero.
Basque Country: P. Ezcurra Loiola.
Valencia: M.D. Marco Macián, A. Salanova Peñalba.
Please cite this article as: Sangrós-González FJ, Martínez-Candela J, Avila-Lachica L, Díez-Espino J, Millaruelo-Trillo JM, García-Soidán J, et al. Control glucémico de los pacientes ancianos con diabetes mellitus tipo 2 en España (2015) y su relación con la capacidad funcional y la comorbilidad. Estudio Escadiane. Rev Clin Esp. 2017;217:495–503.

