

Type 2 diabetes mellitus (DM2) is usually accompanied by various comorbidities that can increase the cost of treatment. We are not aware of studies that have determined the costs associated with treating DM2 patients with comorbidities such as overweight (OW), obesity (OBE) or arterial hypertension (AHT). The aim of the study was to examine the health-related costs and the incidence of cardiovascular disease (CVD) in these patients.
Patients and methodsMulticenter, observational retrospective design. We included patients 40–99 years of age who requested medical attention in 2010 in Badalona (Barcelona, Spain). There were two study groups: those with DM2 and without DM2 (reference group/control), and six subgroups: DM2-only, DM2–AHT, DM2–OW, DM2–OBE, DM2–AHT–OW and DM2–AHT–OBE. The main outcome measures were: comorbidity, metabolic syndrome (MS), complications (hypoglycemia, CVD) and costs (health and non-health). Follow-up was carried out for two years.
ResultsA total of 26,845 patients were recruited. The prevalence of DM2 was 14.0%. Subjects with DM2 were older (67.8 vs. 59.7 years) and more were men (51.3 vs. 43.0%), p<.001. DM2 status was associated primarily with OBE (OR=2.8, CI=2.4–3.1), AHT (OR=2.4, CI=2.2–2.6) and OW (OR=1.9, CI=1.7–2.2). The distribution by subgroups was: 6.7% of patients had only DM2, 26.1% had DM2, AHT and OW, and 34.1% had DM2, AHT, and OBE. Some 75.4% had MS and 37.5% reported an episode of hypoglycemia. The total cost/patient with DM2 was €4458. By subgroups the costs were as follows: DM2: €3431; DM2–AHT: €4075; DM2–OW: €4057; DM2–OBE: €4915; DM2–AHT–OW: €4203 and DM2–AHT–OBE: €5021, p<.001. The CVD rate among patients with DM2 was 4.7 vs. 1.7% in those without DM2 p<.001.
ConclusionsObesity is a comorbidity associated with DM2 that leads to greater healthcare costs than AHT. The presence of these comorbidities causes increased rates of CVD.
La diabetes mellitus tipo 2 (DM2) suele acompañarse de diversas comorbilidades que pueden incrementar el coste de su tratamiento. No conocemos estudios que hayan determinado los costes asociados al tratamiento de los enfermos con DM2 que, además padecen sobrepeso (SP), obesidad (OBE) o hipertensión arterial (HTA). Hemos examinado el gasto sanitario y la incidencia de enfermedad cardiovascular (ECV) en estos enfermos.
Pacientes y métodosDiseño observacional-multicéntrico de carácter retrospectivo. Se incluyeron pacientes entre 40–99 años que demandaron atención durante 2010 en Badalona (Barcelona, España). Se establecieron 2 grupos de estudio: presencia-DM2 y ausencia-DM2 (referencia/control), y 6 subgrupos: DM2-solo, DM2–HTA, DM2–SP, DM2–OBE; DM2–HTA–SP y DM2–HTA–OBE. Las principales medidas fueron: comorbilidad, síndrome metabólico (SM), complicaciones (hipoglucemias, ECV) y costes (sanitarios; no-sanitarios). El seguimiento se realizó durante 2 años.
ResultadosSe reclutaron 26.845 pacientes. La prevalencia de DM2 fue del 14,0%. Los sujetos con DM2 mostraron mayor edad (67,8 vs. 59,7 años) y porcentaje de varones (51,3 vs. 43,0%), p<0,001. La DM2 se asoció principalmente a OBE (OR: 2,8; IC 95%: 2,4–3,1), HTA (OR: 2,4; IC 95%: 2,2–2,6) y SP (OR: 1,9; IC 95%: 1,7–2,2). La distribución por subgrupos osciló entre el 6,7% para los enfermos que solo presentaban DM2, y el 26,1% para los diagnosticados de DM2–HTA–SP y el 34,1% para los que tenían DM2–HTA–OBE. El SM se identificó en el 75,4% y un 37,5% refirió algún episodio de hipoglucemia. El coste-total/paciente con DM2 al cabo de 2 años fue de 4.458€. Por subgrupos fue de DM2: 3.431€; DM2–HTA: 4.075€; DM2–SP: 4.057€; DM2–OBE: 4.915€; DM2–HTA–SP: 4.203€ y DM2–HTA–OBE: 5.02€ (p<0,001). La tasa de ECV en los enfermos con DM2 fue del 4,7%, y del 1,7% en los que no padecían esta condición (p<0,001).
ConclusionesLa OBE es una comorbilidad asociada a la DM2 que origina un mayor gasto sanitario que la HTA. La presencia de estas comorbilidades ocasiona mayores tasas de ECV.
Type 2 diabetes mellitus (DM2) is a disease with a high risk of experienced a vascular disease, especially if it is associated with other cardiovascular risk factors such as obesity and arterial hypertension (AHT). We do not know of any studies that have determined the costs of DM2 with coexisting excess weight, obesity and AHT.
What this article provides?The analysis of 3760 patients with DM2 shows that the costs associated with obesity are higher than those associated with AHT. The incidence of cardiovascular disease was more than 2.5 times higher in patients with DM2 than in those who do not have this condition.
The Editors
Cardiovascular diseases (CVDs) constitute the main cause of morbidity and mortality in developed countries.1 Diabetes is one of the diseases with the highest healthcare impact due to the role it plays as a factor in high cardiovascular risk.2 Type 2 diabetes mellitus (DM2) affects more than 7% of the population, and its incidence is increasing especially in developing countries and among the adolescent population.3–8 Intervention programs directed at increasing exercise, combined with proper diets, are effective at delaying the onset of the disease in participants at risk.9–11 Proper metabolic control is essential for preventing the onset of microvascular and macrovascular complications, which are ultimately the main cause of morbidity and mortality.11–19 The most common acute complication with DM2 is hypoglycemia, especially in patients treated with insulin and/or sulfonylureas.16–18,20
Diabetes is a disease with one of the greatest healthcare impacts, not only for its high prevalence but also for the acute and chronic complications it causes, its high morbidity and mortality and repercussions on the quality of life and for the high consumption of healthcare resources it entails.15–17,21–24 A number of estimates have shown that the annual cost of diabetes just in Spain varies between 710 and 2873 million euros, which represents 1.5–6.2% of the public healthcare expenditure in Spain.23 These estimates might be highly underestimated, given that DM2 alone would have an annual cost of 2403 million euros, according to the CODE-2 study.22 In our community, the mean annual cost per patient with DM2 varies between 1088 and 5279 euros.21–24
Despite the extensive evidence available about the disease,1,2,15–17 we do not know of any studies that have determined the costs associated with comorbidities such as overweight (OW), obesity (OBE) and arterial hypertension (AHT) and the effect of its complications (microvascular and macrovascular). The aim of this study was to assess the clinical (comorbidities, metabolic syndrome [MS], therapeutic control, hypoglycemia and CVD) and financial (use of resources and costs) characteristics associated with DM2 according to certain patterns of comorbidity, in the standard clinical practice in a population setting.
Patients and methodsStudy design and populationWe conducted an observational, multicenter, longitudinal study based on a review of medical registries of patients followed-up in outpatient and hospitals regimens. The study population consisted of individuals belonging to 6 remodeled primary care (PC) centers managed by Badalona Serveis Assistencials SA. Information was obtained on the resources consumed by 2 hospital centers: Municipal Hospital of Badalona and Hospital Germans Trías i Pujol (hospital admissions). The population assigned to the centers was mostly urban, with a low to medium socioeconomic level, predominantly industrial.
Inclusion and exclusion criteriaWe included all patients who required care (2010) and who had the following characteristics: (a) ages between 40 and 99 years; (b) both genders; (c) diagnosed with DM2 for a minimum of 12 months before the start of the study; (d) regularly following the established protocol/guidelines of cardiovascular risk (with the aim of improving the quality of the registries); (e) participating in the long-term prescription program to obtain medical prescriptions (with a confirmed record of the daily dosage, the time interval and duration of each treatment administered); and (f) in whom a regular follow-up could be ensured. Patients were excluded if they were transferred to other institutions, displaced or lost during the follow-up period (24 months; during 2011 and 2012). Patients who developed DM2 before their 40th birthday and those who developed type 1 diabetes mellitus were also excluded.
Diagnosis of type 2 diabetes mellitus and the complicationsThe diagnosis of DM2 was determined based on the international classification of primary care (ICPC-2)25 (T90) and on the coding of hospital and emergency department discharges, according to the international classification of diseases (9th edition, clinical modification [ICD-9-CM] [250]). The following conditions were recorded during the follow-up: (a) hypoglycemia (at the physician's discretion; the record of hypoglycemia was obtained in the regular follow-up visits); (b) microvascular complications (diabetic retinopathy, diabetic nephropathy and diabetic neuropathy); and (c) genitourinary infections. The records were obtained from the registered motives for consultation in the healthcare centers and/or from the computerized clinical protocols during the follow-up.
New cases of CVD or established cases of kidney disease (macrovascular complications) were also counted. These included (a) heart disease, such as cardiac ischemia (codes: K74, K76; stable, unstable and others), acute myocardial infarction (K75) and heart failure (K77), according to the definition of the diagnostic criteria of the World Health Organization; (b) cerebrovascular disease, such as stroke (ischemic or hemorrhagic; according to the American Heart Association) and transient ischemic attack (K90, K91); (c) peripheral arterial disease; and (d) kidney disease (diabetic nephropathy and renal function impairment [serum creatinine: men>133; women>124mmol or glomerular filtration rate<60mL/min]. The results were not standardized because the population pyramid distributed by the age and gender of the study patients was similar to the population of Catalonia. The follow-up of the patients lasted 24 months, which was considered a sufficient period of time, and more robust and homogeneous in the detection of episodes (complications) and their costs.
Treatment descriptionThis was a noninterventional study that collected information from patients treated in the past with antidiabetic agents according to the Anatomical Therapeutic Chemical Classification System (ATC)26 at their physician's discretion. Information on the following oral antidiabetic agents was obtained: (a) metformin (A10BA); (b) insulin-release stimulants: sulfonylureas (A10BB*) and glinides (A10BX); (c) glitazones (A10BG*); (d) alpha-glucosidase inhibitors: acarbose (A10BF*) and miglitol (A10BF*), DPP-4i (A10BH*); and (e) insulin (all types) in monotherapy or in combination (A10BD*).
Study groupsWe established 2 groups (presence and absence of DM2 [control or reference group]) and 6 subgroups: (a) DM2 only; (b) DM2 and AHT; (c) DM2 and OW; (d) DM2 and OBE; (e) DM2, AHT and OW; and (f) DM2, AHT and OBE.
Demographic and comorbidity variablesThe main study variables were: age (continuous and by ranges), gender and the time of evolution of DM2, as well as the personal history obtained based on the ICPC-225: AHT, dyslipidemia (hypertriglyceridemia and/or hypercholesterolemia), OBE, OW, smoking, alcoholism, all types of organ failure (heart, liver and kidneys), ischemic heart disease, stroke, chronic obstructive pulmonary disease, bronchial asthma, dementia or memory disorders, neurological diseases (e.g., Parkinson's disease, epilepsy and multiple sclerosis), depressive syndrome and malignant neoplasms. As a summary variable for overall comorbidity for each treated patient, we used (a) the number of diagnoses; (b) the Charlson index of comorbidity27 as an approximation of patient severity; and (c) the individual case-mix index, obtained based on the Adjusted Clinical Groups (ACG), which is a patient classification system by isoresource consumption.28 The ACG application provides resource utilization bands (RUBs), whereby each patient is grouped according to their overall morbidity into 1 of 5 mutually exclusive categories (1: healthy or very low morbidity; 2: low morbidity; 3: moderate morbidity; 4: high morbidity; and 5: very high morbidity).
Biochemical and anthropometric parameters and definition of metabolic syndromeThe biochemical parameters and/or therapeutic objectives of control were systolic and diastolic blood pressure (mm Hg), body mass index (BMI, kg/m2), baseline glycemia (mg/dL), glycated hemoglobin (%, metabolic control: HbA1c<7%), serum triglycerides, total cholesterol, high-density lipoprotein cholesterol (HDL-C) and low-density lipoprotein cholesterol (LDL-C) (mg/dL). These parameters were obtained at the start and end of the study (2-year follow-up). OW was defined as a BMI between 25 and 29.9kg/m2 and OBE as a BMI≥30kg/m2.
MS was established when an individual patient met 3 of the 5 following criteria (modified from the Adult Treatment Panel [ATP] III28): (a) triglycerides levels ≥150mg/dL; (b) HDL-C levels <40mg/dL in men or <50mg/dL in women; (c) systolic/diastolic blood pressure ≥130/85mm Hg or in antihypertensive treatment; (d) baseline glycemia under fasting conditions ≥110mg/dL or in hypoglycemic treatment or previously diagnosed diabetes; and (e) BMI≥28.8kg/m2. This study replaced one of the standard components of MS, the measurement of waist circumference, with the measurement of BMI, which constitutes one of the modified criteria of the NCEP-ATP III.29 The individual component criterion of MS was considered met if the BMI was ≥28.8kg/m2. This value has been considered equivalent to abdominal adiposity (waist circumference >102cm in men and >88cm in women), the original criterion followed by various authors.30
Use of resources and cost modelWe considered direct healthcare costs (direct costs) to be those related to the health care activities (medical visits, days in the hospital, emergency department, diagnostic and therapeutic requests, etc.) carried out by professionals. The indirect costs were those related to the loss of work productivity (disability days). The cost was expressed in mean cost per patient during the 2 years of study follow-up (cost/unit). The various study concepts and their economic assessments were obtained from a recently published study.31
Statistical analysisWe performed a descriptive-univariate statistical analysis and 95% confidence intervals (CI). We determined the normality of the distribution with the Kolmogorov–Smirnov test. In the bivariate analysis, we used ANOVA, Chi-squared, Pearson's linear correlation and the comparison of means for paired groups. We performed a logistic regression analysis to obtain the variables associated with the patient's profile (dependent variable), with the enter procedure (statistic: Wald). We also performed a multiple linear regression model (consecutive steps) to assess the variables associated with the healthcare cost. The comparison of the outpatient and hospital costs was performed according to the recommendations of Thompson and Barber32 using analysis of covariance (ANCOVA), with gender, age, RUBs, Charlson index and progression time of the diagnosis as covariates (procedure: determination of marginal measures; Bonferroni correction). We used the SPSS® program version 17, establishing a statistical significance for values of p<.05.
ResultsThe study population was formed by 52,370 participants aged ≥40 years. Of these, 38,295 required attention; 26,845 patients were ultimately selected. By study groups, 14.0% (N=3760; 95% CI 13.7–14.2%) belonged to the DM2 diagnosis group and 86.0% (N=23,085) belonged to the reference/control group (Fig. 1).

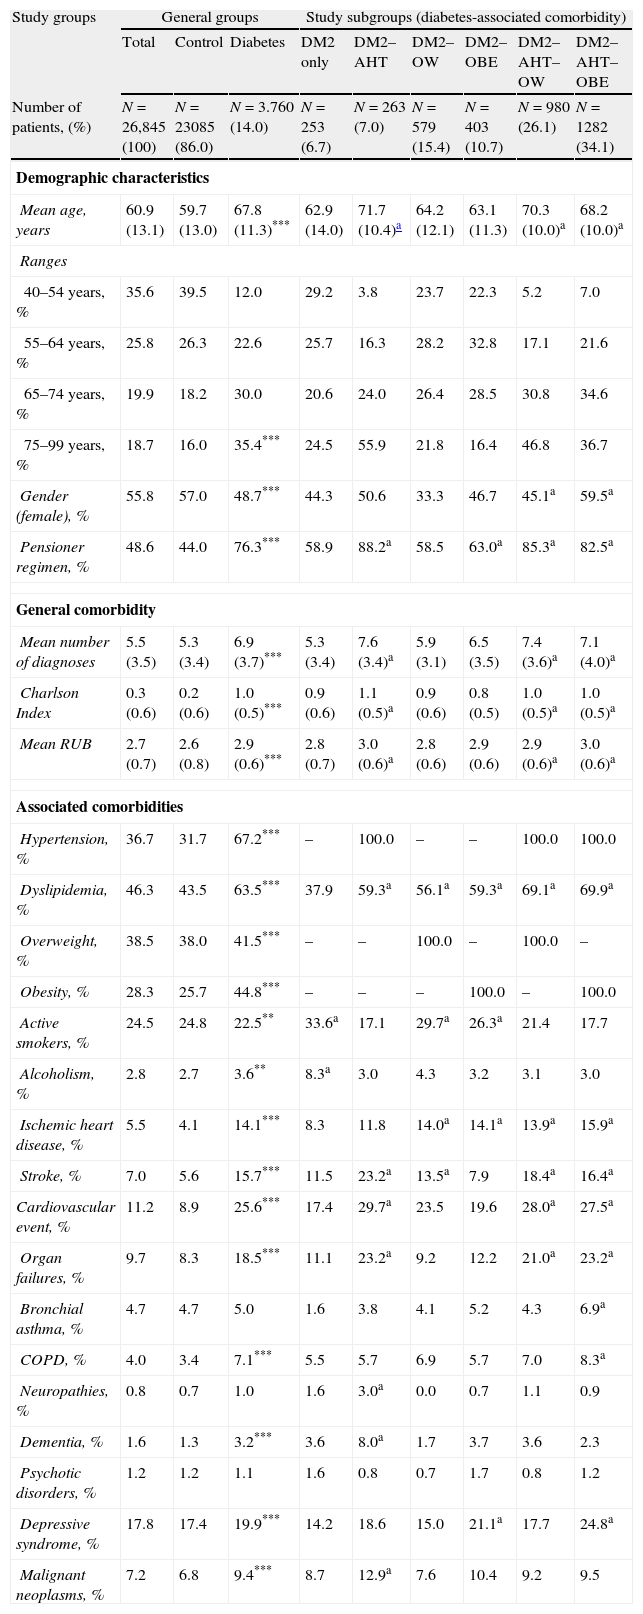
The baseline characteristics of the study series are shown in Table 1 according to the patient groups and subgroups. In the logistic regression model, DM2 was associated mostly with OBE (OR, 2.8; 95% CI 2.4–3.1), AHT (OR, 2.4; 95% CI 2.2–2.6), and OW (OR, 1.9; 95% CI 1.7–2.2). DM2 was less likely to be associated with dyslipidemia (OR, 1.5; 95% CI 1.4–1.7), ischemic heart disease (OR, 1.5; 95% CI 1.1–2.0), stroke (OR, 1.4; 95% CI 1.1–1.8), male gender ((OR, 1.2; 95% CI 1.1–1.3) and age (OR, 1.2; 95% CI 1.1–1.3) (p<.05). The distribution of the DM2 group by subgroups of factors was as follows: 6.7% with DM2 only (N=253; 95% CI 5.9–7.5%), 7.0% with DM2–AHT (N=263; 95% CI 6.2–7.8%), 15.4% with DM2–OW (N=579; 95% CI 14.2–16.6%), 10.7% with DM2–OBE (N=403; 95% CI 9.7–11.7%), 26.1% with DM2–AHT–OW (N=980; 95% CI 24.7–27.5%) and 34.1% with DM2–AHT–OBE (N=1282; 95% CI 32.6–35.6%).
Baseline characteristics of the study series.
| Study groups | General groups | Study subgroups (diabetes-associated comorbidity) | |||||||
| Total | Control | Diabetes | DM2 only | DM2–AHT | DM2–OW | DM2–OBE | DM2–AHT–OW | DM2–AHT–OBE | |
| Number of patients, (%) | N=26,845 (100) | N=23085 (86.0) | N=3.760 (14.0) | N=253 (6.7) | N=263 (7.0) | N=579 (15.4) | N=403 (10.7) | N=980 (26.1) | N=1282 (34.1) |
| Demographic characteristics | |||||||||
| Mean age, years | 60.9 (13.1) | 59.7 (13.0) | 67.8 (11.3)*** | 62.9 (14.0) | 71.7 (10.4)a | 64.2 (12.1) | 63.1 (11.3) | 70.3 (10.0)a | 68.2 (10.0)a |
| Ranges | |||||||||
| 40–54 years, % | 35.6 | 39.5 | 12.0 | 29.2 | 3.8 | 23.7 | 22.3 | 5.2 | 7.0 |
| 55–64 years, % | 25.8 | 26.3 | 22.6 | 25.7 | 16.3 | 28.2 | 32.8 | 17.1 | 21.6 |
| 65–74 years, % | 19.9 | 18.2 | 30.0 | 20.6 | 24.0 | 26.4 | 28.5 | 30.8 | 34.6 |
| 75–99 years, % | 18.7 | 16.0 | 35.4*** | 24.5 | 55.9 | 21.8 | 16.4 | 46.8 | 36.7 |
| Gender (female), % | 55.8 | 57.0 | 48.7*** | 44.3 | 50.6 | 33.3 | 46.7 | 45.1a | 59.5a |
| Pensioner regimen, % | 48.6 | 44.0 | 76.3*** | 58.9 | 88.2a | 58.5 | 63.0a | 85.3a | 82.5a |
| General comorbidity | |||||||||
| Mean number of diagnoses | 5.5 (3.5) | 5.3 (3.4) | 6.9 (3.7)*** | 5.3 (3.4) | 7.6 (3.4)a | 5.9 (3.1) | 6.5 (3.5) | 7.4 (3.6)a | 7.1 (4.0)a |
| Charlson Index | 0.3 (0.6) | 0.2 (0.6) | 1.0 (0.5)*** | 0.9 (0.6) | 1.1 (0.5)a | 0.9 (0.6) | 0.8 (0.5) | 1.0 (0.5)a | 1.0 (0.5)a |
| Mean RUB | 2.7 (0.7) | 2.6 (0.8) | 2.9 (0.6)*** | 2.8 (0.7) | 3.0 (0.6)a | 2.8 (0.6) | 2.9 (0.6) | 2.9 (0.6)a | 3.0 (0.6)a |
| Associated comorbidities | |||||||||
| Hypertension, % | 36.7 | 31.7 | 67.2*** | – | 100.0 | – | – | 100.0 | 100.0 |
| Dyslipidemia, % | 46.3 | 43.5 | 63.5*** | 37.9 | 59.3a | 56.1a | 59.3a | 69.1a | 69.9a |
| Overweight, % | 38.5 | 38.0 | 41.5*** | – | – | 100.0 | – | 100.0 | – |
| Obesity, % | 28.3 | 25.7 | 44.8*** | – | – | – | 100.0 | – | 100.0 |
| Active smokers, % | 24.5 | 24.8 | 22.5** | 33.6a | 17.1 | 29.7a | 26.3a | 21.4 | 17.7 |
| Alcoholism, % | 2.8 | 2.7 | 3.6** | 8.3a | 3.0 | 4.3 | 3.2 | 3.1 | 3.0 |
| Ischemic heart disease, % | 5.5 | 4.1 | 14.1*** | 8.3 | 11.8 | 14.0a | 14.1a | 13.9a | 15.9a |
| Stroke, % | 7.0 | 5.6 | 15.7*** | 11.5 | 23.2a | 13.5a | 7.9 | 18.4a | 16.4a |
| Cardiovascular event, % | 11.2 | 8.9 | 25.6*** | 17.4 | 29.7a | 23.5 | 19.6 | 28.0a | 27.5a |
| Organ failures, % | 9.7 | 8.3 | 18.5*** | 11.1 | 23.2a | 9.2 | 12.2 | 21.0a | 23.2a |
| Bronchial asthma, % | 4.7 | 4.7 | 5.0 | 1.6 | 3.8 | 4.1 | 5.2 | 4.3 | 6.9a |
| COPD, % | 4.0 | 3.4 | 7.1*** | 5.5 | 5.7 | 6.9 | 5.7 | 7.0 | 8.3a |
| Neuropathies, % | 0.8 | 0.7 | 1.0 | 1.6 | 3.0a | 0.0 | 0.7 | 1.1 | 0.9 |
| Dementia, % | 1.6 | 1.3 | 3.2*** | 3.6 | 8.0a | 1.7 | 3.7 | 3.6 | 2.3 |
| Psychotic disorders, % | 1.2 | 1.2 | 1.1 | 1.6 | 0.8 | 0.7 | 1.7 | 0.8 | 1.2 |
| Depressive syndrome, % | 17.8 | 17.4 | 19.9*** | 14.2 | 18.6 | 15.0 | 21.1a | 17.7 | 24.8a |
| Malignant neoplasms, % | 7.2 | 6.8 | 9.4*** | 8.7 | 12.9a | 7.6 | 10.4 | 9.2 | 9.5 |
Abbreviations: AHT, arterial hypertension; COPD, chronic obstructive pulmonary disease; DM2, type 2 diabetes; OBE, obesity; OW, overweight; RUB, resource utilization bands; SS, social security.
Values expressed in percentages or mean (standard deviation).
Overall p-value in the general comparison among groups: ap<.05; **p<.01; ***p<.001.
In the subgroups, statistically significant differences compared with the control group.
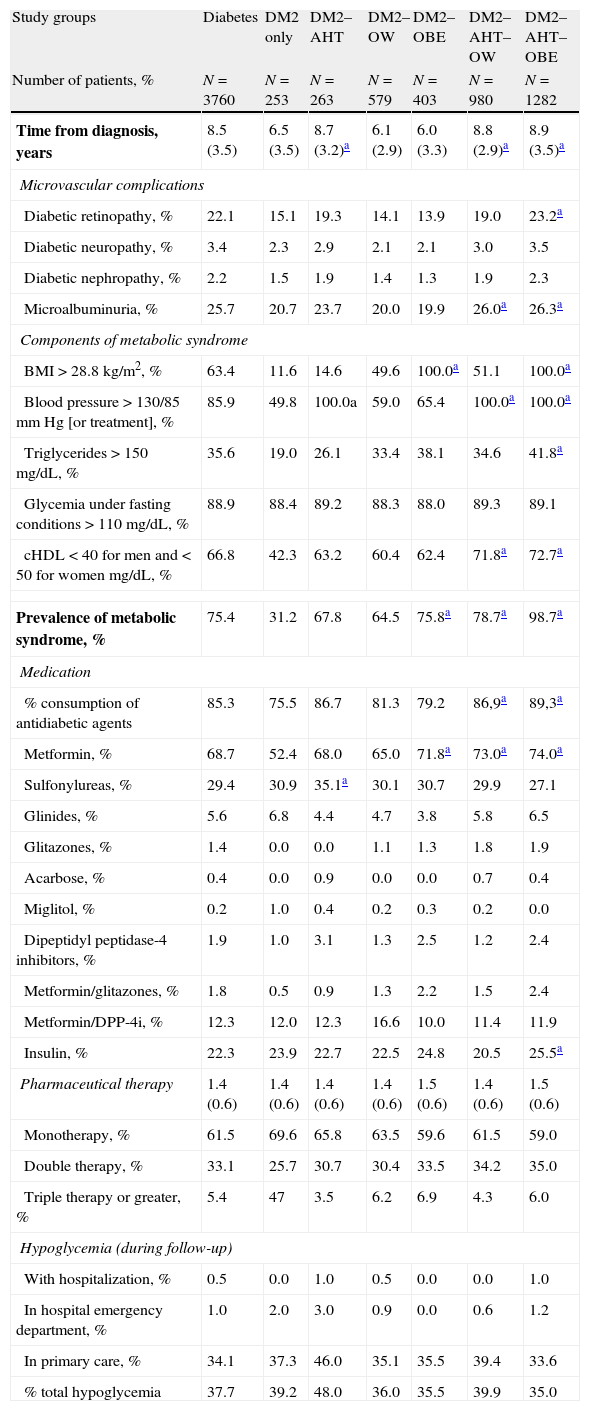
The distribution of microvascular complications, the prevalence of MS, the antidiabetic medication and the hypoglycemia of the patients with DM2 are listed in Table 2. The prevalence of MS in DM2 was 75.4% (95% CI: 74.0–75.8%) and was greater in the DM2–OBE (75.8%), DM2–AHT–OW (78.7%) and especially DM2–AHT–OBE (98.7%) subgroups (p<.01). The consumption of antidiabetic agents and hypoglycemic agents was 85.3% and 37.5%, respectively (41.3% in PC). There was a noteworthy reduction in the control group of triglyceride levels (118.6–115.2mg/dL; p<.001) and total cholesterol (209.8–207.3mm Hg; p<.001). The group with DM2 showed greater reductions (150.8–141.8mg/dL; p<.001) and total cholesterol (191.1–182.0mm Hg; p<.001). These differences were also shown in all subgroups analyzed. Some 60.0% of the patients with DM2 showed proper metabolic control (95% CI: 58.4–61.6%).
Distribution of microvascular complications, prevalence of ms, antidiabetic medication and hypoglycemia of patients with diabetes.
| Study groups | Diabetes | DM2 only | DM2–AHT | DM2–OW | DM2–OBE | DM2–AHT–OW | DM2–AHT–OBE |
| Number of patients, % | N=3760 | N=253 | N=263 | N=579 | N=403 | N=980 | N=1282 |
| Time from diagnosis, years | 8.5 (3.5) | 6.5 (3.5) | 8.7 (3.2)a | 6.1 (2.9) | 6.0 (3.3) | 8.8 (2.9)a | 8.9 (3.5)a |
| Microvascular complications | |||||||
| Diabetic retinopathy, % | 22.1 | 15.1 | 19.3 | 14.1 | 13.9 | 19.0 | 23.2a |
| Diabetic neuropathy, % | 3.4 | 2.3 | 2.9 | 2.1 | 2.1 | 3.0 | 3.5 |
| Diabetic nephropathy, % | 2.2 | 1.5 | 1.9 | 1.4 | 1.3 | 1.9 | 2.3 |
| Microalbuminuria, % | 25.7 | 20.7 | 23.7 | 20.0 | 19.9 | 26.0a | 26.3a |
| Components of metabolic syndrome | |||||||
| BMI>28.8kg/m2, % | 63.4 | 11.6 | 14.6 | 49.6 | 100.0a | 51.1 | 100.0a |
| Blood pressure>130/85mm Hg [or treatment], % | 85.9 | 49.8 | 100.0a | 59.0 | 65.4 | 100.0a | 100.0a |
| Triglycerides>150mg/dL, % | 35.6 | 19.0 | 26.1 | 33.4 | 38.1 | 34.6 | 41.8a |
| Glycemia under fasting conditions>110mg/dL, % | 88.9 | 88.4 | 89.2 | 88.3 | 88.0 | 89.3 | 89.1 |
| cHDL<40 for men and <50 for women mg/dL, % | 66.8 | 42.3 | 63.2 | 60.4 | 62.4 | 71.8a | 72.7a |
| Prevalence of metabolic syndrome, % | 75.4 | 31.2 | 67.8 | 64.5 | 75.8a | 78.7a | 98.7a |
| Medication | |||||||
| % consumption of antidiabetic agents | 85.3 | 75.5 | 86.7 | 81.3 | 79.2 | 86,9a | 89,3a |
| Metformin, % | 68.7 | 52.4 | 68.0 | 65.0 | 71.8a | 73.0a | 74.0a |
| Sulfonylureas, % | 29.4 | 30.9 | 35.1a | 30.1 | 30.7 | 29.9 | 27.1 |
| Glinides, % | 5.6 | 6.8 | 4.4 | 4.7 | 3.8 | 5.8 | 6.5 |
| Glitazones, % | 1.4 | 0.0 | 0.0 | 1.1 | 1.3 | 1.8 | 1.9 |
| Acarbose, % | 0.4 | 0.0 | 0.9 | 0.0 | 0.0 | 0.7 | 0.4 |
| Miglitol, % | 0.2 | 1.0 | 0.4 | 0.2 | 0.3 | 0.2 | 0.0 |
| Dipeptidyl peptidase-4 inhibitors, % | 1.9 | 1.0 | 3.1 | 1.3 | 2.5 | 1.2 | 2.4 |
| Metformin/glitazones, % | 1.8 | 0.5 | 0.9 | 1.3 | 2.2 | 1.5 | 2.4 |
| Metformin/DPP-4i, % | 12.3 | 12.0 | 12.3 | 16.6 | 10.0 | 11.4 | 11.9 |
| Insulin, % | 22.3 | 23.9 | 22.7 | 22.5 | 24.8 | 20.5 | 25.5a |
| Pharmaceutical therapy | 1.4 (0.6) | 1.4 (0.6) | 1.4 (0.6) | 1.4 (0.6) | 1.5 (0.6) | 1.4 (0.6) | 1.5 (0.6) |
| Monotherapy, % | 61.5 | 69.6 | 65.8 | 63.5 | 59.6 | 61.5 | 59.0 |
| Double therapy, % | 33.1 | 25.7 | 30.7 | 30.4 | 33.5 | 34.2 | 35.0 |
| Triple therapy or greater, % | 5.4 | 47 | 3.5 | 6.2 | 6.9 | 4.3 | 6.0 |
| Hypoglycemia (during follow-up) | |||||||
| With hospitalization, % | 0.5 | 0.0 | 1.0 | 0.5 | 0.0 | 0.0 | 1.0 |
| In hospital emergency department, % | 1.0 | 2.0 | 3.0 | 0.9 | 0.0 | 0.6 | 1.2 |
| In primary care, % | 34.1 | 37.3 | 46.0 | 35.1 | 35.5 | 39.4 | 33.6 |
| % total hypoglycemia | 37.7 | 39.2 | 48.0 | 36.0 | 35.5 | 39.9 | 35.0 |
Abbreviations: AHT, arterial hypertension; DM2, type 2 diabetes; DPP-4i, dipeptidyl peptidase-4 inhibitors; OBE, obesity; OW, overweight.
Prevalence of metabolic syndrome in the control group: 21.6%; values expressed in percentages or mean (standard deviation).
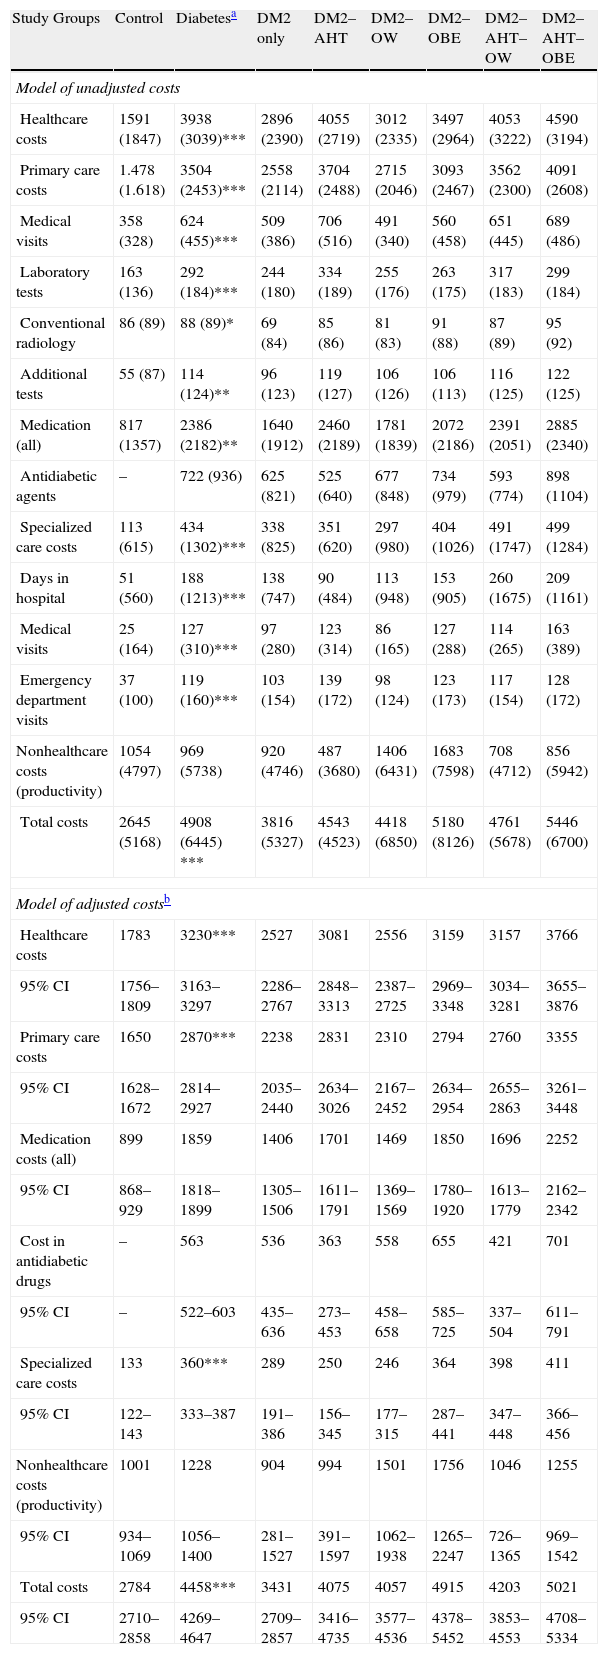
The participants with DM2, when compared with those of the control/reference group, attended more medical visits in PC (26.9 vs. 15.4; p<.001), spent more days in hospital (0.6 vs. 0.2; p=.001) and attended a greater number of specialized care visits (1.2 vs. 0.2; p<.001). There were no differences in the number of disability days. By DM2 subgroups, the use of resources was more noteworthy among patients with DM2–AHT–OW and DM2–AHT–OBE. The model of raw and adjusted (by covariates) costs according to the study groups is described in Table 3. In the healthcare costs, 89.0% corresponded to PC costs (medication: 60.5%, medical visits: 15.8%) and 11.0% to specialized care (medical visits: 3.2%). The average per unit of the total costs of the participants with DM2 compared with those of the control/reference group were superior (€4908 vs. €2645; p<.001). In the adjusted model (ANCOVA), these costs were of €4458 (95% CI: €4269–€4647) versus €2784 (95% CI: €2710–€2858) (p<.001). Additionally, the healthcare costs of the patients with DM2 were greater in the participants with poor metabolic control (HbA1c<7%; €4118 vs. €3406, p<.001), with MS (€4128 vs. €3048, p<.001) and with a prior history of CVD (€5448 vs. €3418, p<.001).
Model of raw and adjusted costs (24-month follow-up) according to the study groups (in euros).
| Study Groups | Control | Diabetesa | DM2 only | DM2–AHT | DM2–OW | DM2–OBE | DM2–AHT–OW | DM2–AHT–OBE |
| Model of unadjusted costs | ||||||||
| Healthcare costs | 1591 (1847) | 3938 (3039)*** | 2896 (2390) | 4055 (2719) | 3012 (2335) | 3497 (2964) | 4053 (3222) | 4590 (3194) |
| Primary care costs | 1.478 (1.618) | 3504 (2453)*** | 2558 (2114) | 3704 (2488) | 2715 (2046) | 3093 (2467) | 3562 (2300) | 4091 (2608) |
| Medical visits | 358 (328) | 624 (455)*** | 509 (386) | 706 (516) | 491 (340) | 560 (458) | 651 (445) | 689 (486) |
| Laboratory tests | 163 (136) | 292 (184)*** | 244 (180) | 334 (189) | 255 (176) | 263 (175) | 317 (183) | 299 (184) |
| Conventional radiology | 86 (89) | 88 (89)* | 69 (84) | 85 (86) | 81 (83) | 91 (88) | 87 (89) | 95 (92) |
| Additional tests | 55 (87) | 114 (124)** | 96 (123) | 119 (127) | 106 (126) | 106 (113) | 116 (125) | 122 (125) |
| Medication (all) | 817 (1357) | 2386 (2182)** | 1640 (1912) | 2460 (2189) | 1781 (1839) | 2072 (2186) | 2391 (2051) | 2885 (2340) |
| Antidiabetic agents | – | 722 (936) | 625 (821) | 525 (640) | 677 (848) | 734 (979) | 593 (774) | 898 (1104) |
| Specialized care costs | 113 (615) | 434 (1302)*** | 338 (825) | 351 (620) | 297 (980) | 404 (1026) | 491 (1747) | 499 (1284) |
| Days in hospital | 51 (560) | 188 (1213)*** | 138 (747) | 90 (484) | 113 (948) | 153 (905) | 260 (1675) | 209 (1161) |
| Medical visits | 25 (164) | 127 (310)*** | 97 (280) | 123 (314) | 86 (165) | 127 (288) | 114 (265) | 163 (389) |
| Emergency department visits | 37 (100) | 119 (160)*** | 103 (154) | 139 (172) | 98 (124) | 123 (173) | 117 (154) | 128 (172) |
| Nonhealthcare costs (productivity) | 1054 (4797) | 969 (5738) | 920 (4746) | 487 (3680) | 1406 (6431) | 1683 (7598) | 708 (4712) | 856 (5942) |
| Total costs | 2645 (5168) | 4908 (6445) *** | 3816 (5327) | 4543 (4523) | 4418 (6850) | 5180 (8126) | 4761 (5678) | 5446 (6700) |
| Model of adjusted costsb | ||||||||
| Healthcare costs | 1783 | 3230*** | 2527 | 3081 | 2556 | 3159 | 3157 | 3766 |
| 95% CI | 1756–1809 | 3163–3297 | 2286–2767 | 2848–3313 | 2387–2725 | 2969–3348 | 3034–3281 | 3655–3876 |
| Primary care costs | 1650 | 2870*** | 2238 | 2831 | 2310 | 2794 | 2760 | 3355 |
| 95% CI | 1628–1672 | 2814–2927 | 2035–2440 | 2634–3026 | 2167–2452 | 2634–2954 | 2655–2863 | 3261–3448 |
| Medication costs (all) | 899 | 1859 | 1406 | 1701 | 1469 | 1850 | 1696 | 2252 |
| 95% CI | 868–929 | 1818–1899 | 1305–1506 | 1611–1791 | 1369–1569 | 1780–1920 | 1613–1779 | 2162–2342 |
| Cost in antidiabetic drugs | – | 563 | 536 | 363 | 558 | 655 | 421 | 701 |
| 95% CI | – | 522–603 | 435–636 | 273–453 | 458–658 | 585–725 | 337–504 | 611–791 |
| Specialized care costs | 133 | 360*** | 289 | 250 | 246 | 364 | 398 | 411 |
| 95% CI | 122–143 | 333–387 | 191–386 | 156–345 | 177–315 | 287–441 | 347–448 | 366–456 |
| Nonhealthcare costs (productivity) | 1001 | 1228 | 904 | 994 | 1501 | 1756 | 1046 | 1255 |
| 95% CI | 934–1069 | 1056–1400 | 281–1527 | 391–1597 | 1062–1938 | 1265–2247 | 726–1365 | 969–1542 |
| Total costs | 2784 | 4458*** | 3431 | 4075 | 4057 | 4915 | 4203 | 5021 |
| 95% CI | 2710–2858 | 4269–4647 | 2709–2857 | 3416–4735 | 3577–4536 | 4378–5452 | 3853–4553 | 4708–5334 |
Values expressed in mean (SD, standard deviation).
Abbreviations: AHT, arterial hypertension; CI, confidence interval; DM2, type 2 diabetes; OBE, obesity; OW, excess weight.
In the subgroups, there are significant differences compared with the control group in all components, except in the disability days.
The patients with DM2, when compared with the control group, had higher rates in all events: CVD (4.7% vs. 1.7%, p<.001), renal failure (1.8% vs. 0.6%, p<.001) and genitourinary infections (11.2% vs. 8.6%, p<.001). By subgroups (DM2 only, DM2–AHT, DM2–OW, DM2–OBE, DM2–AHT–OW and DM2–AHT–OBE), the rates of CVD were 4.7%, 4.6%, 2.1%, 5.0%, 4.8% and 5.6%, respectively (p<.001); the rates of heart failure were 1.6%, 0.8%, 1.2%, 1.5%, 1.8% and 2.6%, respectively (p<.001); the rates of renal failure were 0.1%, 1.9%, 0.3%, 1.0%, 3.4% and 1.9%, respectively (p<.001); and the rates of genitourinary infection were 10.7%, 13.7%, 8.3%, 9.2%, 11.1% and 12.7%, respectively (p<.001). The differences were statistically significant in the DM2–AHT–OW and DM2–AHT–OBE subgroups (in all episodes).
In the logistic regression model (adjusted by covariates), the presence of CVD in patients with diabetes was associated with poor metabolic control of DM2 (OR, 2.8); male gender (OR, 2.3); OBE (OR, 1.8); dyslipidemia (OR, 1.7); AHT (OR, 1.5); and OW (OR, 1.4). Hypoglycemia was associated with dyslipidemia (OR, 1.5), OBE (OR, 1.7) and general comorbidity (Charlson index; OR, 1.3). Moreover, the healthcare costs (adjusted by covariates) were associated with hospital readmissions (β=0.432), age (β=0.196), OBE (β=0.117), poor metabolic control (β=0.093) and hypoglycemia (β=0.052).
DiscussionThis study shows that patients with DM2 have a strong association with OBE, AHT and OW, a situation that can cause higher rates of CVD (complications) and healthcare costs during the progression of the disease. The uniqueness of the study lies in the joint measurement of the analyzed variables (metabolic control, complications and costs), which can be considered one of the strengths of the study.
The results of the study highlight the association of DM2 with OW, OBE and AHT.8–11,13,14,17 It is noteworthy that the group with DM2–AHT–OBE was more prevalent than the DM2–AHT–OW group. This situation might be due to a casual effect, although the most plausible explanation is that the subgroup with OW consisted of older patients who might present a reduction in adipose tissue.12,13 The results of the prevalence of MS are consistent with other published studies.33,34 The results on metabolic control, meanwhile, are similar or slightly greater than the data found in the literature.13,14,35,36 This situation could be due to the fact that our data are more recent; however, there is still a certain margin for improvement, as indicated by scientific societies.15,16 DM2 is a disease with one of the greatest healthcare impacts due to its high mortality rate, its repercussions on quality of life and the high consumption of healthcare resources it entails.15,16 Hypoglycemia rates were 37.5%, and there were no differences between the study subgroups. We can therefore assume that the patients’ tolerance and safety profile (pharmacokinetic and pharmacodynamic properties), along with the distribution of DPP-4i, was similar among the subgroups analysed.
The cost analysis should be interpreted as a strength of the study. These were associated with readmissions (CVD), age, OBE, poor metabolic control and hypoglycemia. The limited studies available show that as compliance and metabolic control of these patients increase, the lower the risk of hospitalization.37 Nevertheless, there was considerable variability in the studies reviewed, a situation that hinders the comparison of the results. In general, our results are consistent with these studies22,23 highlighting the association of hypoglycemia with the costs.38,39,40 Ballesta and Carral,41 in a sample of 517 patients with DM2, estimated an annual direct cost associated with diabetes of €2504. There was a significant association between the total costs associated with DM2 and the following variables: time of evolution of the diabetes, average HbA1c value and the presence of complications. Giorda et al.42 reaffirmed the manner in which an effective therapy with good metabolic control can reduce the risk of complications and represents a valid strategy from an economic point of view. With the previously mentioned limitations, our results are consistent with the reviewed data.43
The potential limitations of the study lie in the accurate diagnosis of DM2, the possible bias of patient classification and the operational measurement of costs, attributable to the information system developed. Other limitations of the study include the lack of measurement of a number of variables (therapeutic compliance, socioeconomic level, etc.), although their distribution should also be similar in the study groups (clinical variables) analyzed. Another limitation of the study lies in the measurement of hypoglycemia, given that we only identified episodes in which the patient required medical care and in which this care was documented; episodes of hypoglycemia could therefore have been underdiagnosed. From a strictly pharmacoeconomic point of view, it is much more desirable to analyze expenditures according to parameters that are potentially modifiable, such as the presence or absence of hypoglycemia, metabolic control and even the control of other associated risk factors. This situation could therefore be interpreted as a limitation of the study. Another limitation is in regard to metabolic control; good metabolic control is generally considered an A1c<7%; however, this is currently a subject of discussion based on the current recommendation of individualizing the objectives. Another limitation of the study could be due to not having included patients with DM2 who were younger than 40 years, although the repercussion of this is slight.
The future perspectives offered by this study are focused on replicating the study in other healthcare institutions, as well as improving the strategies conducted by multidisciplinary teams to promote effective interventions in the reduction of OBE, in which patients are highly involved in their own care. In conclusion, DM2 has a significant association with OBE, AHT and OW. DM2–OBE creates more costs than DM2–AHT. The presence of these factors in DM2 can result in higher rates of CVD and healthcare costs in the national health system.
Contribution of the authorsConcept and design of the manuscript: A. Sicras, R. Navarro and J. Ibáñez.
Data collection: A. Sicras.
Data analysis and interpretation: A. Sicras.
Drafting, review and approval of the submitted manuscript: A. Sicras, R. Navarro and J. Ibáñez.
FundingThis study was funded by Bristol-Myers Squibb and Astra-Zeneca.
Conflicts of interestThe authors declare that they have no conflicts of interest.
Please cite this article as: Sicras-Mainar A, Navarro-Artieda R, Ibáñez-Nolla J. Características clínicas y económicas asociadas a la diabetes tipo 2. Rev Clin Esp. 2014;214:121–130.

