Determine the incidence and risk factors of type 2 diabetes in the adult population of Madrid (Spain) and compare the predictive models of type 2 diabetes based on the prediabetes criteria of the American Diabetes Association (ADA) and the World Health Organisation (WHO).
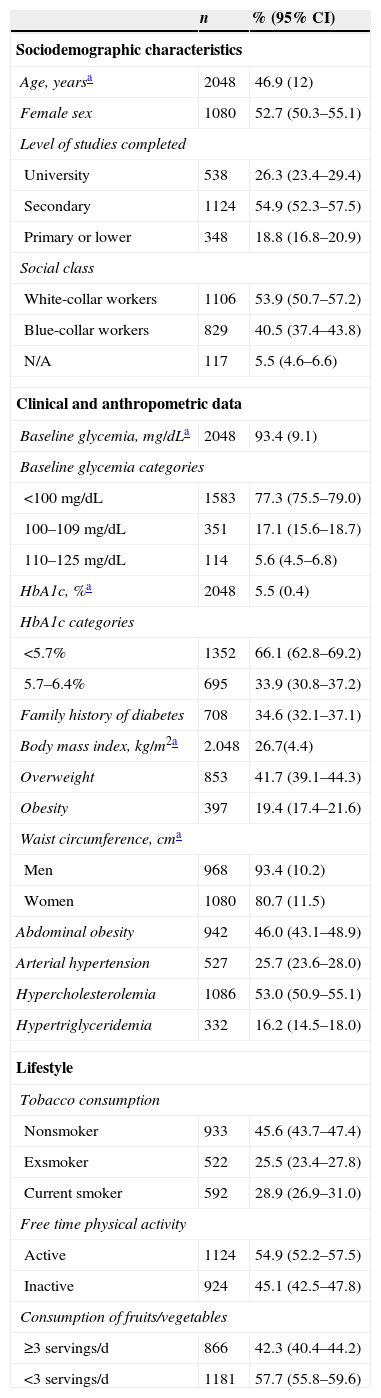
Material and methodsA prospective study was conducted on a population cohort composed of 2048 individuals between 30 and 74years of age with no diabetes. At the start of the study, an epidemiological survey was performed, and baseline glycaemia, HbA1c, body mass index and waist circumference were measured. A follow-up of 6.4years was conducted. New cases of type 2 diabetes were identified using the electronic primary care medical history.
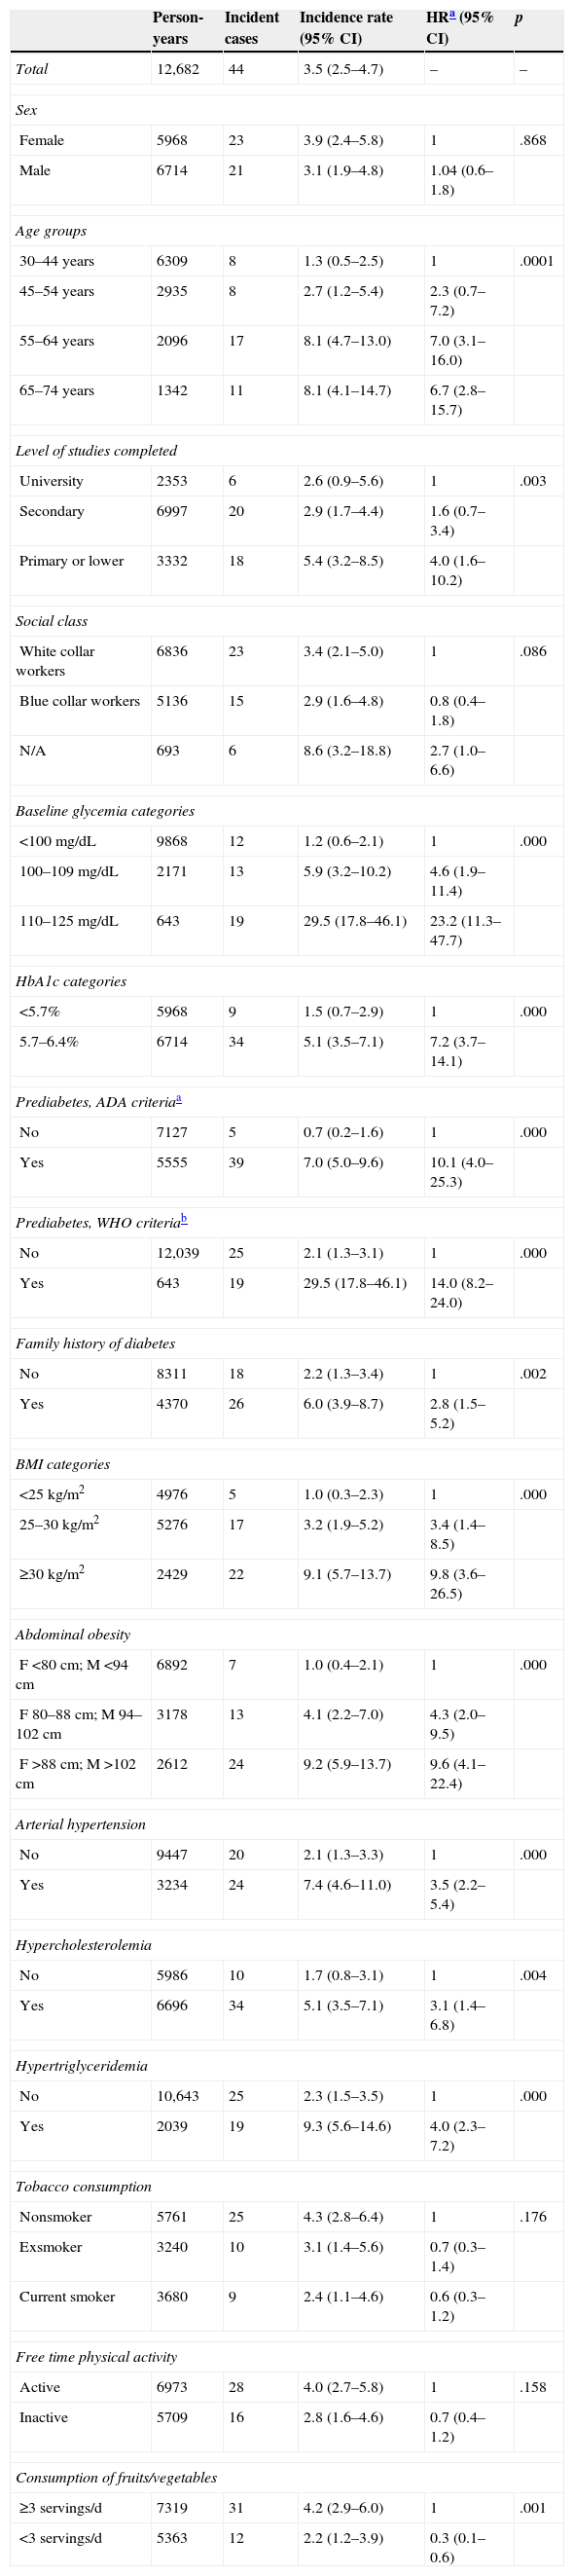
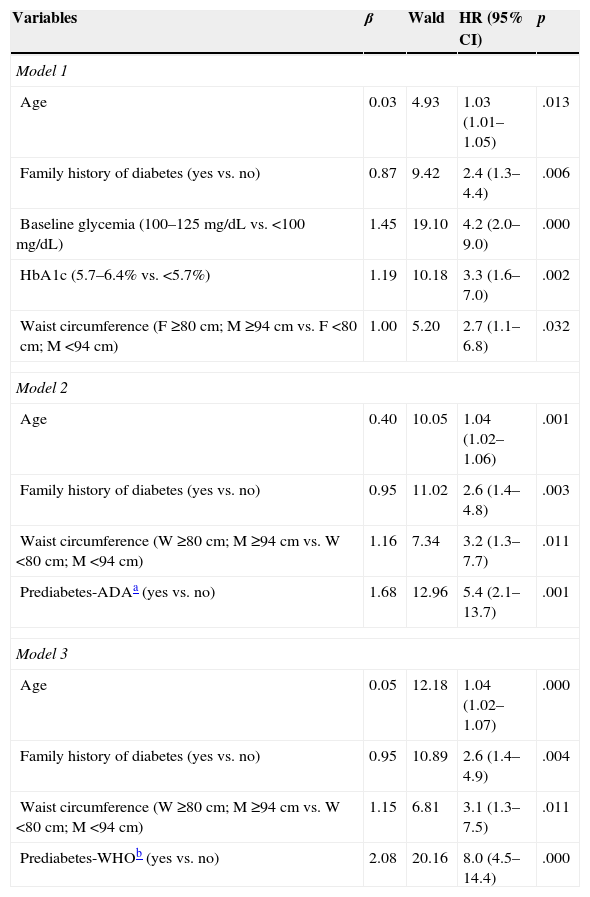
ResultsThe incidence of type 2 diabetes was 3.5 cases/1000 person-years. In the multivariate analysis, the variables that were associated with the onset of type 2 diabetes were age, family history of diabetes, baseline glycaemia (100–125mg/dL), HbA1c (5.7–6.4%) and waist circumference (≥94cm for men and ≥80cm for women). Of these, the most significantly associated variables were baseline glycaemia and HbA1c. The ADA and WHO criteria for defining prediabetes had the same predictive capacity.
ConclusionThe incidence of type 2 diabetes measured in Madrid was lower than that found in other population studies, with the glucometabolic state the main factor associated with progression to type 2 diabetes. There were no differences between the prediabetes defined by the ADA and the WHO for predicting the onset of the disease.
Estimar la incidencia y los factores de riesgo de diabetes tipo 2 en la población adulta de Madrid (España) y comparar los modelos predictivos de diabetes tipo 2 basados en los criterios de prediabetes de la American Diabetes Association (ADA) y la Organización Mundial de la Salud (OMS).
Material y métodosEstudio prospectivo de una cohorte poblacional formada por 2048 individuos de entre 30 y 74años sin diabetes. Al inicio del estudio se realizó una encuesta epidemiológica y se midió la glucemia basal, la HbA1c, el índice de masa corporal y el perímetro de la cintura. Se realizó un seguimiento de 6,4años. Los casos nuevos de diabetes tipo 2 se identificaron a través de la historia clínica electrónica de atención primaria.
ResultadosLa incidencia de diabetes tipo 2 fue 3,5 casos/1.000 personas-año. En el análisis multivariante las variables que se asociaron con la aparición de diabetes tipo 2 fueron la edad, los antecedentes familiares de diabetes, la glucemia basal (100–125mg/dL), la HbA1c (5,7–6,4%) y el perímetro de la cintura (≥94cm en hombres y ≥80cm en mujeres). De estas, las más significativamente asociadas fueron la glucemia basal y la HbA1c. Los criterios de la ADA y la OMS para definir prediabetes tuvieron la misma capacidad predictiva.
ConclusiónLa incidencia de diabetes tipo 2 estimada en Madrid fue inferior a la encontrada en otros estudios poblacionales, siendo el estado glucometabólico el principal factor asociado a la progresión a diabetes tipo 2. No se han detectado diferencias entre la prediabetes definida por la ADA y la OMS para predecir la aparición de la enfermedad.
Diabetes is one of the most significant health problems of our time due to its high prevalence, morbidity, mortality and high costs.1 Recent studies have estimated that the prevalence of diabetes in Spain is approximately 13–15%2 and has been increasing in recent years.3 Data on the incidence of type 2 diabetes (DM2) in our community are scarce and highly variable, with rates from 1.5 to 19 new cases/1000 residents-year.4–7 The progression from normoglycemia to diabetes can take years, and there can be intermediate states in which blood glucose levels are higher than normal but without reaching clearly diabetic levels.8 These intermediate or prediabetes cases are not considered clinical entities, although they do constitute a risk factor for developing diabetes. The American Diabetes Association (ADA)9 and the World Health Organization (WHO)10 concur in their definition of glucose intolerance but differ in the basal glucose (BG) disorder criteria and in the use of HbA1c to diagnose prediabetes.
The risk of developing DM2 in persons with prediabetes is up to 6 times greater than in those with normal glucose levels. Each year, 5–10% of people with prediabetes develop diabetes, and 70% will develop diabetes during their lifetime.8 Numerous studies have demonstrated that DM2 can be prevented or at least delayed by taking action on lifestyle-related risk factors.11,12
The main objective of this study is to determine the incidence of DM2 in the adult population of the Community of Madrid and to determine the factors associated with its onset. The secondary objective is to compare the capacity of the ADA and WHO prediabetes criteria for predicting the onset of this disease.
Material and methodsThis was a prospective population study from the PREDIMERC cohort,13 which was formed in 2007. A random sample of 2268 people between 30 and 74years of age was selected, all residents of Madrid, using sampling by conglomerates with stratification by basic health areas, including 60 areas to ensure territorial representation. The patients’ response rate was 56.4%. The study methodology has been previously described.13 The baseline study was conducted via a telephone survey and a standard physical examination. Blood pressure, weight, height and waist circumference were measured. A fasting blood sample was taken to determine BG, HbA1c, cholesterol and triglyceride levels.
Patients with DM2 at the start were excluded, based on the following criteria: BG≥126mg/dL, HbA1c≥6.5%, a previous diagnosis of DM2 or hypoglycemia treatment. The follow-up period was from August 1, 2007 to December 31, 2013. The study employed the primary care electronic medical record (EMR) (AP-Madrid Program). The records of DM2 diagnoses and hypoglycemia treatments were annually reviewed, considering a case to be incident if the date on record was later than that of the start of the follow-up.
At the start of the study, individuals were classified in terms of their glucose metabolic status according to the ADA (BG of 100–125mg/dL or HbA1c of 5.7–6.4%9) and WHO criteria (BG of 110–125mg/dL).10 Data on the patients’ family history of diabetes (first and second-degree relatives) were collected. Based on the body mass index (BMI), patients were classified as normal weight (BMI<25kg/m2), overweight (BMI of25–29.9kg/m2) or obese (BMI≥30kg/m2). Abdominal obesity was considered when the waist circumference was ≥94cm for men and ≥80cm for women. High blood pressure was defined as a systolic blood pressure ≥140mmHg or a diastolic blood pressure ≥90mmHg or if the participant was undergoing high blood pressure treatment. Hypercholesterolemia was considered when the cholesterol levels were ≥200mg/dL or if the patient was undergoing hypolipidemic treatment; hypertriglyceridemia was considered when the triglycerides levels were ≥150mg/dL. In terms of tobacco use, patients were classified as current smoker, exsmoker or nonsmoker. Physical activity was measured using a structured diary of activities performed in the last two weeks,14 considering those who had performed no activity as inactive. As an indicator of diet quality, the consumption of fruits and vegetables was assessed, considering low consumption to be <3 servings/day. The socioeconomic variables assessed included the level of studies completed (primary or lower, secondary and university) and social class according to occupation, with participants classified as white collar (nonmanual) workers (classes I, II and III) and blue collar (manual) laborers (classes IV, V), following the methodology of the Spanish Society of Epidemiology.15
The categorical variables are presented as percentages and 95% confidence intervals (95% CI), and the quantitative variables are presented with mean and standard deviation (SD). The distribution of the quantitative variables was analyzed. The incidence rate of DM2 was estimated based on the study's main predictors, as well as the rate ratio (hazard ratio [HR]) with a 95% CI. To determine the factors associated with the development of DM2, a Cox proportional hazards model was constructed, whose maximum starting point included the variables that had a significance level <0.15 in the univariate analysis, and those with clinical relevance, regardless of their significance. The model's predictive capacity was determined using the Harrell's c statistic, and its calibration was determined by the Gronnesby–Borgan test. To compare the predictive capacity of the prediabetes criteria of the ADA and WHO, a model was created for each.
Observations were weighted on the basis of the population structure of Madrid by age group and sex. The effect of the sampling design was considered when calculating the 95% CI. The significance level used for hypothesis testing was 0.05. The statistical analysis was performed using SPSS-21 and Stata-11.
All participants were fully informed and signed their consent to participate in the study, which was approved by the Ethics Committee for Clinical Research of Hospital Ramón y Cajal (Madrid).
ResultsOf the 2268 people initially included, 220 were subsequently excluded: 203 individuals with diabetes, 3 individuals who lacked HbA1c data and 14 individuals who were recorded in AP-Madrid as having a diagnosis of diabetes or undergoing antidiabetic treatment before the start of the follow-up. The cohort was composed of 2048 people, 52.7% of whom were women, with a mean age of 46.9years (SD, 12). The majority of the patients had completed secondary studies and performed nonmanual work. Some 22.9% of the patients had BG levels ≥100mg/dL, 33% had HbA1c values ≥5.7%, and 34.6% had a family history of diabetes. A total of 19.4% of the participants were obese, and 46% had abdominal obesity. Some 45.1% did not perform any physical activity, and 57.7% consumed <3 servings of fruits and vegetables per day (Table 1).
Clinical and epidemiological characteristics of the population at the start of the study.
n | % (95% CI) | |
---|---|---|
Sociodemographic characteristics | ||
Age, yearsa | 2048 | 46.9 (12) |
Female sex | 1080 | 52.7 (50.3–55.1) |
Level of studies completed | ||
University | 538 | 26.3 (23.4–29.4) |
Secondary | 1124 | 54.9 (52.3–57.5) |
Primary or lower | 348 | 18.8 (16.8–20.9) |
Social class | ||
White-collar workers | 1106 | 53.9 (50.7–57.2) |
Blue-collar workers | 829 | 40.5 (37.4–43.8) |
N/A | 117 | 5.5 (4.6–6.6) |
Clinical and anthropometric data | ||
Baseline glycemia, mg/dLa | 2048 | 93.4 (9.1) |
Baseline glycemia categories | ||
<100mg/dL | 1583 | 77.3 (75.5–79.0) |
100–109mg/dL | 351 | 17.1 (15.6–18.7) |
110–125mg/dL | 114 | 5.6 (4.5–6.8) |
HbA1c, %a | 2048 | 5.5 (0.4) |
HbA1c categories | ||
<5.7% | 1352 | 66.1 (62.8–69.2) |
5.7–6.4% | 695 | 33.9 (30.8–37.2) |
Family history of diabetes | 708 | 34.6 (32.1–37.1) |
Body mass index, kg/m2a | 2.048 | 26.7(4.4) |
Overweight | 853 | 41.7 (39.1–44.3) |
Obesity | 397 | 19.4 (17.4–21.6) |
Waist circumference, cma | ||
Men | 968 | 93.4 (10.2) |
Women | 1080 | 80.7 (11.5) |
Abdominal obesity | 942 | 46.0 (43.1–48.9) |
Arterial hypertension | 527 | 25.7 (23.6–28.0) |
Hypercholesterolemia | 1086 | 53.0 (50.9–55.1) |
Hypertriglyceridemia | 332 | 16.2 (14.5–18.0) |
Lifestyle | ||
Tobacco consumption | ||
Nonsmoker | 933 | 45.6 (43.7–47.4) |
Exsmoker | 522 | 25.5 (23.4–27.8) |
Current smoker | 592 | 28.9 (26.9–31.0) |
Free time physical activity | ||
Active | 1124 | 54.9 (52.2–57.5) |
Inactive | 924 | 45.1 (42.5–47.8) |
Consumption of fruits/vegetables | ||
≥3 servings/d | 866 | 42.3 (40.4–44.2) |
<3 servings/d | 1181 | 57.7 (55.8–59.6) |
Fig. 1 shows the losses during follow-up (5%), which were most frequently due to moving out of the community. After 6.4years of follow-up, 44 incident cases of DM2 were detected, which correspond to an incidence of 3.5 cases/1000 person-years. Table 2 shows the incidence and HR according to the variables studied. No significant differences based on sex were observed. The risk of DM2 increased significantly with age and was associated with a lower level of education but not social class. The incidence of DM2 was greater in people with a family history of diabetes, obesity, abdominal obesity, high blood pressure, hypercholesterolemia and hypertriglyceridemia. A clear relationship was not found with tobacco consumption or physical activity. In addition, an inverse association was found with the consumption of fruits and vegetables.
Incidence rates for type 2 diabetes (per 1000 person-years) in total and according to exposure variables at the start of the study.
Person-years | Incident cases | Incidence rate (95% CI) | HRa (95% CI) | p | |
---|---|---|---|---|---|
Total | 12,682 | 44 | 3.5 (2.5–4.7) | – | – |
Sex | |||||
Female | 5968 | 23 | 3.9 (2.4–5.8) | 1 | .868 |
Male | 6714 | 21 | 3.1 (1.9–4.8) | 1.04 (0.6–1.8) | |
Age groups | |||||
30–44 years | 6309 | 8 | 1.3 (0.5–2.5) | 1 | .0001 |
45–54 years | 2935 | 8 | 2.7 (1.2–5.4) | 2.3 (0.7–7.2) | |
55–64 years | 2096 | 17 | 8.1 (4.7–13.0) | 7.0 (3.1–16.0) | |
65–74 years | 1342 | 11 | 8.1 (4.1–14.7) | 6.7 (2.8–15.7) | |
Level of studies completed | |||||
University | 2353 | 6 | 2.6 (0.9–5.6) | 1 | .003 |
Secondary | 6997 | 20 | 2.9 (1.7–4.4) | 1.6 (0.7–3.4) | |
Primary or lower | 3332 | 18 | 5.4 (3.2–8.5) | 4.0 (1.6–10.2) | |
Social class | |||||
White collar workers | 6836 | 23 | 3.4 (2.1–5.0) | 1 | .086 |
Blue collar workers | 5136 | 15 | 2.9 (1.6–4.8) | 0.8 (0.4–1.8) | |
N/A | 693 | 6 | 8.6 (3.2–18.8) | 2.7 (1.0–6.6) | |
Baseline glycemia categories | |||||
<100mg/dL | 9868 | 12 | 1.2 (0.6–2.1) | 1 | .000 |
100–109mg/dL | 2171 | 13 | 5.9 (3.2–10.2) | 4.6 (1.9–11.4) | |
110–125mg/dL | 643 | 19 | 29.5 (17.8–46.1) | 23.2 (11.3–47.7) | |
HbA1c categories | |||||
<5.7% | 5968 | 9 | 1.5 (0.7–2.9) | 1 | .000 |
5.7–6.4% | 6714 | 34 | 5.1 (3.5–7.1) | 7.2 (3.7–14.1) | |
Prediabetes, ADA criteriaa | |||||
No | 7127 | 5 | 0.7 (0.2–1.6) | 1 | .000 |
Yes | 5555 | 39 | 7.0 (5.0–9.6) | 10.1 (4.0–25.3) | |
Prediabetes, WHO criteriab | |||||
No | 12,039 | 25 | 2.1 (1.3–3.1) | 1 | .000 |
Yes | 643 | 19 | 29.5 (17.8–46.1) | 14.0 (8.2–24.0) | |
Family history of diabetes | |||||
No | 8311 | 18 | 2.2 (1.3–3.4) | 1 | .002 |
Yes | 4370 | 26 | 6.0 (3.9–8.7) | 2.8 (1.5–5.2) | |
BMI categories | |||||
<25kg/m2 | 4976 | 5 | 1.0 (0.3–2.3) | 1 | .000 |
25–30kg/m2 | 5276 | 17 | 3.2 (1.9–5.2) | 3.4 (1.4–8.5) | |
≥30kg/m2 | 2429 | 22 | 9.1 (5.7–13.7) | 9.8 (3.6–26.5) | |
Abdominal obesity | |||||
F <80cm; M <94cm | 6892 | 7 | 1.0 (0.4–2.1) | 1 | .000 |
F 80–88cm; M 94–102cm | 3178 | 13 | 4.1 (2.2–7.0) | 4.3 (2.0–9.5) | |
F >88cm; M >102cm | 2612 | 24 | 9.2 (5.9–13.7) | 9.6 (4.1–22.4) | |
Arterial hypertension | |||||
No | 9447 | 20 | 2.1 (1.3–3.3) | 1 | .000 |
Yes | 3234 | 24 | 7.4 (4.6–11.0) | 3.5 (2.2–5.4) | |
Hypercholesterolemia | |||||
No | 5986 | 10 | 1.7 (0.8–3.1) | 1 | .004 |
Yes | 6696 | 34 | 5.1 (3.5–7.1) | 3.1 (1.4–6.8) | |
Hypertriglyceridemia | |||||
No | 10,643 | 25 | 2.3 (1.5–3.5) | 1 | .000 |
Yes | 2039 | 19 | 9.3 (5.6–14.6) | 4.0 (2.3–7.2) | |
Tobacco consumption | |||||
Nonsmoker | 5761 | 25 | 4.3 (2.8–6.4) | 1 | .176 |
Exsmoker | 3240 | 10 | 3.1 (1.4–5.6) | 0.7 (0.3–1.4) | |
Current smoker | 3680 | 9 | 2.4 (1.1–4.6) | 0.6 (0.3–1.2) | |
Free time physical activity | |||||
Active | 6973 | 28 | 4.0 (2.7–5.8) | 1 | .158 |
Inactive | 5709 | 16 | 2.8 (1.6–4.6) | 0.7 (0.4–1.2) | |
Consumption of fruits/vegetables | |||||
≥3 servings/d | 7319 | 31 | 4.2 (2.9–6.0) | 1 | .001 |
<3 servings/d | 5363 | 12 | 2.2 (1.2–3.9) | 0.3 (0.1–0.6) |
Abbreviations: HR, hazard ratio.
BG values ≥100mg/dL and HbA1c levels ≥5.7% were significantly associated with a greater incidence of DM2 (HR for BG values of 100–109mg/dL, BG values of 110–125mg/dL and HbA1c values of 5.7–6.4% were 4.6, 23.2 and 7.2, respectively). The incidence of DM2 was greater among the individuals with prediabetes (7 cases/1000 person-years) according to the ADA criteria (HR, 10.1) compared with 29.5 cases/1000 person-years according to the WHO criteria (HR, 14.0).
In the multivariate analysis, the variables associated with the onset of DM2 were age, a family history of diabetes, BG values of 100–125mg/dL, HbA1c values of 5.7–6.4% and waist circumferences of ≥94cm for men and ≥80cm for women (Table 3). Overall, the model obtained a Harrell's c statistic of 0.85 (95% CI 0.80–0.89), and the Gornnesby–Borgan test showed a good calibration of the model (p=.752), without finding significant differences in the predictive capacity for detecting DM2 between the ADA (Harrell's c, 0.82) and WHO prediabetes criteria (Harrell's c, 0.84; p=.234).
Multivariate cox proportional risk models for predicting the risk of developing type 2 diabetes.
Variables | β | Wald | HR (95% CI) | p |
---|---|---|---|---|
Model 1 | ||||
Age | 0.03 | 4.93 | 1.03 (1.01–1.05) | .013 |
Family history of diabetes (yes vs. no) | 0.87 | 9.42 | 2.4 (1.3–4.4) | .006 |
Baseline glycemia (100–125mg/dL vs. <100mg/dL) | 1.45 | 19.10 | 4.2 (2.0–9.0) | .000 |
HbA1c (5.7–6.4% vs. <5.7%) | 1.19 | 10.18 | 3.3 (1.6–7.0) | .002 |
Waist circumference (F ≥80cm; M ≥94cm vs. F <80cm; M <94cm) | 1.00 | 5.20 | 2.7 (1.1–6.8) | .032 |
Model 2 | ||||
Age | 0.40 | 10.05 | 1.04 (1.02–1.06) | .001 |
Family history of diabetes (yes vs. no) | 0.95 | 11.02 | 2.6 (1.4–4.8) | .003 |
Waist circumference (W ≥80cm; M ≥94cm vs. W <80cm; M <94cm) | 1.16 | 7.34 | 3.2 (1.3–7.7) | .011 |
Prediabetes-ADAa (yes vs. no) | 1.68 | 12.96 | 5.4 (2.1–13.7) | .001 |
Model 3 | ||||
Age | 0.05 | 12.18 | 1.04 (1.02–1.07) | .000 |
Family history of diabetes (yes vs. no) | 0.95 | 10.89 | 2.6 (1.4–4.9) | .004 |
Waist circumference (W ≥80cm; M ≥94cm vs. W <80cm; M <94cm) | 1.15 | 6.81 | 3.1 (1.3–7.5) | .011 |
Prediabetes-WHOb (yes vs. no) | 2.08 | 20.16 | 8.0 (4.5–14.4) | .000 |
Abbreviations: F, female; M, male; HR, hazard ratio; 95% CI, 95% confidence interval.
Data on the incidence of DM2 in Spain is scarce, which is probably due to the lack of studies providing sufficiently representative data. The age and sex breakdown of our sample reproduces that of the Madrid population from 30 to 74years of age with broad territorial representation. The results can therefore be extrapolated to the adult population of Madrid.
The incidence rate observed in our study was 3.5 cases/1000 person-years. The population studies conducted in Spain vary in terms of the methodology employed and the study population, which makes it difficult to compare the data. Vázquez et al.5 measured an incidence of 8.2/1000 person-years in the population older than 30years in Lejona, Valdés et al.6 measured a rate of 10.8 cases/1000 person-years in the Asturian population 30–75years of age, and Soriguer et al.7 measured a rate of 19.1 cases/1000 person-years in the Malaga population 18–65years of age. The lower incidence found in our study might be due to the different age range of the population studied and the exclusion of individuals with HbA1c levels ≥6.5%, as well as the method employed for diagnosing incident cases.
Moreover, we found a significant increase in the incidence in Madrid, compared with that estimated by Zorrilla et al.4 via sentinel physicians in the 1990s, which was 1.46 per 1000 habitants older than 14years of age. This increasing trend is consistent with the increase in the prevalence observed in population-based studies conducted in the first decade of the 21st century, when compared with previous decades.3
As expected, the incidence of DM2 increased linearly with age, with the onset of diabetes occurring most frequently starting at 55–60years of age.16,17 The inverse relationship with educational level has been widely reported.18 Similarly, the presence of a family history of diabetes constitutes a significant risk factor.19,20 Meigs et al.19 observed that the risk of diabetes was similar when one of the parents had diabetes (RR, 3.5) and doubled when both parents had the disease (RR, 6.1).
In terms of glucose metabolic status, our results are consistent with the epidemiological studies that showed that people with elevated BG and HbA1c levels are at greater risk of progressing to diabetes.21–24 The risk of DM2 increases starting from BG values ≥100mg/dL (HR of 4.6 for BG levels of 100–109mg/dL; HR of 23.2 for BG levels of 110–125mg/dL), which is similar to the results of the Pizarra study (RR of 5.3 for BG levels of 100–109mg/dL)7 and higher than those found in the Asturias study (RR of 11.5 for BG levels of 110–125mg/dL).6 The stratum of our cohort with HbA1c values of 5.7–6.4% were at greater risk of DM2 (HR, 7.2). Lerner et al.25 found that the risk was exponential starting from values of 5.5%, doubling for every 0.5% increase in HbA1c. Cheng et al.26 also found that HbA1c was predictive of diabetes, increasing the risk progressively starting from a value of 5%, going from 1.7 to 16 for HbA1c levels of 6.0–6.4%.
Obesity is one of the main risk factors for DM2.27 In our study, both BMI and waist circumference were associated with DM2. It is well known that BMI is a good predictor of DM2, although recent studies have given waist circumference an increasing role. Abdominal fat predicts the development of DM2 better than BMI, such that waist circumference constitutes a more important risk factor than BMI.27–29 Numerous studies have demonstrated that performing physical activity reduces the risk of DM2.30 However, our study did not observe an association between physical inactivity and DM2. We also studied the consumption of fruits and vegetables as an indicator of the quality of the diet. Although the association between DM2 and the consumption of fruit and vegetables is not clear,31,32 it has been clearly demonstrated that a healthy diet is associated with a lower incidence of DM2.31,33 Our study found a greater incidence in individuals who ate 3 or more servings of fruits and vegetables per day, but no interaction was found with age. This datum might be explained by the fact that older people generally have better eating habits.17 This result could also be related to the validity and reliability of the questionnaires used to measure physical activity and food consumption.
In the multivariate model, the factors associated with a risk of DM were age, family history of diabetes, BG levels of 100–125mg/dL, HbA1c levels of 5.7–6.4% and waist circumference ≥102cm in men and ≥80cm in women. These variables globally predicted 85% of the appearance of DM2 (Harrell's c, 0.85). The low number of incident cases might have influenced the association of certain variables with the appearance of DM2, given that the low number limited the number of variables in the construction of the maximum starting model.
We found no differences in the predictive capacity of the prediabetic states according to the ADA and WHO criteria. The differences between the ADA and WHO criteria in terms of defining prediabetes have generated debate in numerous studies. The application of the ADA criteria has led to a significant increase in individuals classified as prediabetic.34–37 Valdés et al.35 confirmed that the inclusion of BG levels of 100–109mg/dL for prediabetes increased the sensitivity (from 43.2% to 75%) for predicting diabetes, and the combination of BG levels and HbA1c ≥5.5% achieves an excellent predictive value for diabetes (AUC, 0.88).38 These results were similar to those observed by Heianza et al. in the Japanese population.23
Patient follow-was conducted using the primary care EMR, whose use in epidemiological studies is increasing.39 In a prior study, we assessed the validity and concordance of the diabetes diagnoses recorded in the primary care EMR compared with the date from the PREDIMERC study. The sensitivity, specificity and concordance of the EMR for detecting known or diagnosed diabetes was 83.5%, 98.1% and 0.79 respectively.40 Burgos et al.41 demonstrated the validity of the diabetes diagnoses recorded in the EMR for epidemiological studies, finding that 99.5% of the cases complied with the diagnostic criteria of diabetes.
It is important to consider a possible selection bias related to the response rate of the baseline study (56.4%), although it is similar to other population studies that examine health and that include biological samples.42 In addition, AP-Madrid only includes users of the public health system. Considering that health coverage in Spain is greater than 95%, it would be expected that underestimation would be minor.
In conclusion, the study provides a valuable estimate of the incidence of DM2 and its associated factors in the Community of Madrid and is the first prospective population study conducted in the region. The results reveal the importance of the glucose metabolic state as a predictive factor for DM2. This finding corroborates the recommendation to use HbA1c and BG as criteria for identifying the population at high risk of developing diabetes and those who would benefit from inclusion in prevention programs.
FundingThis study was partially funded by the 2007–2009 Healthcare Research Fund (Fondo de Investigación Sanitaria, FIS PI07/1213).
Conflict of interestThe authors declare that they have no conflicts of interest.
We wish to thank Luis Miguel Blanco Ancos for his help in preparing the primary care databases, to the company Demométrica for performing the field work and to the participants for their generous contribution to the study.
Please cite this article as: Gil-Montalbán E, Martín-Ríos MD, Ortiz-Marrón H, Zorrilla-Torras B, Martínez-Cortés M, Esteban-Vasallo MD, et al. Incidencia de diabetes tipo 2 y factores asociados en la población adulta de la Comunidad de Madrid. Cohorte PREDIMERC. Rev Clin Esp. 2015;215:495–502.