

To evaluate the degree of glycemic control in patients with type 2 diabetes in Spain and identify factors associated with glycemic control.
Patients and methodsThis was a cross-sectional, multicenter, epidemiological study that used consecutive sampling and was conducted in primary care practices in Spain. A total of 5591 patients with type 2 diabetes mellitus lasting more than 1 year and who were treated with hypoglycemic agents for more than 3 months were included in the study. At a single visit, HbA1c levels were measured (A1cNow+ system) and demographic and clinical variables related to diabetes and its treatment were recorded. During the visit, CV risk factors (CVRF), the presence of target-organ damage (TOD), the presence of hypoglycemia and body weight changes within the previous year were recorded.
ResultsWe analyzed data from 5382 patients (mean age 66.7 [10.8] years, mean duration of the diabetes 8.8 [6.3] years). TOD was present in 43.6% of the patients and 59.1% were taking 2 or more drugs. The patients’ mean HbA1c was 7.1 (1.1)%, and 48.6% had HbA1c levels <7.0%. The patients with HbA1c levels ≥7.0% had longer-standing diabetes, a higher prevalence of TOD and CVRF, used more complex therapies, experienced more hypoglycemic episodes in the previous year and had more weight gain. In the multivariate analysis, the absence of insulin treatment, the absence of abdominal obesity and atherogenic dyslipidemia, a duration of the diabetes <10 years and an age >70 years were associated with improved glycemic control.
ConclusionsPatients with poorly controlled type 2 diabetes mellitus are highly prevalent in Spain. Factors associated with poorer glycemic control include the complexity of both the disease and the hypoglycemic therapy, a history of hypoglycemia and weight gain.
Evaluar el grado de control glucémico en los pacientes con diabetes tipo 2 (DM2) en España, e identificar los factores asociados con el nivel de control glucémico.
Pacientes y métodosEstudio epidemiológico transversal, multicéntrico realizado en consultas de atención primaria en España. Se incluyeron 5.591 pacientes con DM2 (>1 año evolución) y con tratamiento farmacológico (>3 meses). En una única visita, se determinó la HbA1c (sistema A1cNow+) y se registraron las variables relacionadas con la diabetes y su tratamiento, los factores de riesgo cardiovascular (FRCV), la presencia de lesiones de órgano diana (LOD), y la presencia de hipoglucemia y modificación del peso en el año previo.
ResultadosSe analizaron los datos de 5.382 pacientes (edad media 66,7 años; 8,8 años de evolución); el 43,6% presentaban alguna LOD y el 59,1% recibían ≥2 fármacos. La HbA1c media fue de 7,1 (1,1)% y el 48,6% tenían HbA1c <7,0%. Los pacientes con HbA1c ≥7,0% presentaban mayor duración de la diabetes, mayor prevalencia de LOD y FRCV, usaban terapias más complejas y en el año previo presentaron más hipoglucemias y mayor aumento de peso. En el análisis multivariante, la ausencia de tratamiento con insulina, la ausencia de obesidad abdominal y dislipemia aterogénica, el tiempo de evolución de DM2 <10 años y la edad >70 años se asociaron con mejor control glucémico.
Conclusionesla proporción de DM2 con deficiente control en España es elevada. Los factores que reflejan la complejidad de la enfermedad y del tratamiento hipoglucemiante, así como el antecedente de hipoglucemia y aumento de peso, se asocian con peor control glucémico.
Glycemic control (HbA1c) is an essential determinant in the progression of type 2 diabetes mellitus (the prevalence of DM2 in the Spanish population is 13.8%). This study assessed the degree of glycemic control with a new procedure for measuring HbA1c in the doctor's office as well as the factors associated with good control.
What this article provides?In 5382 patients with DM2 (mean age, 67 years), the mean HbA1C was 7.1%, and 49% of the patients had <7.0% (good control). Forty-four percent had an organ lesion and 59% took 2 or more diabetes drugs. The factors associated with good control in the multivariate analysis were a progression time <10 years, age >70 years and an absence of abdominal obesity, atherogenic dyslipidemia and insulin treatment.
The Editors
Diabetes mellitus is a chronic disease with a prevalence of 13.8% in our community.1 The microvascular and macrovascular complications of diabetes, as well as its high cardiovascular mortality, make diabetes a disease with considerable health and social repercussions. The disease requires continuous care and represents a significant consumption of healthcare resources.2 Treatment according to clinical practice guidelines has demonstrated a reduction in morbidity and mortality and improvements in the quality of life.3–5 However, most studies (regardless of country) show considerable difficulty in achieving the therapeutic objectives, especially in terms of glycemic control. In Spain, the most recent studies performed in primary care show that >40% of patients have HbA1c levels >7.0%.6–8 In a previous study performed on a population with type 2 diabetes (DM2) who were treated in primary and specialized care in which 97.8% of the patients were treated with drugs, we observed that only 40.4% of the patients had HbA1c levels <7.0%. Furthermore, this proportion decreased with the progression of the disease, as well as the complexity of the process and of the treatment.8 One of the major limitations of most of these studies is the lack of information on the methods used to determine HbA1c levels and the scarce information on factors that could contribute to glycemic control, especially weight fluctuations, the presence of hypoglycemia and the insulin regimen used.
The present study is therefore designed to assess the degree of glycemic control in individuals with DM2 using the measurement of HbA1c levels with the A1cNow+ system and identify factors (related to diabetes and hyperglycemia therapy) associated with the degree of glycemic control, including the insulin regimen, changes in body weight and the presence of hypoglycemia the previous year.
Participants and methodsStudy designThis was an epidemiological, cross-sectional and multicenter study, with sequential sampling performed in primary care consultations throughout Spain under standard clinical practice conditions between 2011 and 2012. A total of 1797 researchers participated in the study in a nonrandom distribution among the 13 autonomous communities of Spain. These researchers recruited the first 3 patients with DM2 who visited their office and met the inclusion and exclusion criteria.
The study included patients who were 18 years or older, diagnosed with DM2 at least 12 months prior to inclusion, treated with an antidiabetic drug regimen for at least 3 months prior to inclusion in the study and having HbA1c levels in capillary blood measured in the study visit with the A1cNow+ system. The study excluded patients with type 1 diabetes, secondary diabetes, DM2 with no drug treatment and patients who presented a clinically relevant medical condition, which at the investigator's discretion made their participation in the study inadvisable. The study also excluded patients whose capillary HbA1c values on the day of the visit were not available and those with unspecified hyperglycemic treatment.
Variables recorded in the study and assessment criteriaThe main variable was the HbA1c level in capillary blood measured using the A1cNow+ system, which demonstrates adequate precision compared with standardized laboratory methods (National Glycohemoglobin Standardization Program).9 Adequate glycemic control was defined as an HbA1c level <7.0%.
In addition, demographic and anthropometric data (age, sex, height, weight, body mass index [BMI], abdominal circumference), tobacco consumption (cigarettes/day) and blood pressure were recorded. The laboratory data correspond to values of the last laboratory test prior to the consultation and included the following: total cholesterol (mg/dL), low-density lipoprotein cholesterol (mg/dL), high-density lipoprotein cholesterol (mg/dL), triglycerides (mg/dL) and albuminuria (mg/g creatinine). The glomerular filtration rate was determined using the Modification of Diet in Renal Disease formula. The cardiovascular risk factors (CRF) were defined according to the criteria of the American Diabetes Association. Microalbuminuria was defined as a creatinine value ≥30mg/g on 2 occasions. The classification of the Kidney Disease Outcomes Quality Initiative was used to define the kidney disease stages.
The presence of target-organ damage (TOD) was recorded while considering the following: (1) heart disease (left ventricular hypertrophy, heart failure or atrial fibrillation), (2) any macrovascular lesion in the heart (angina, acute myocardial infarction, revascularization), cerebrovascular lesion (transient ischemic attack, stroke) or peripheral arterial disease (lower limb arteriopathy, vascular amputation) and (3) any microvascular lesion in the eyes (proliferative and nonproliferative diabetic retinopathy, amaurosis), kidneys (microalbuminuria, proteinuria, renal failure) or nervous system (diabetic neuropathy, diabetic foot).
We recorded the diabetes progression time, whether the patient self-controlled their glycemia, the presence of hypoglycemia and changes in weight in the year prior to the visit, according to the data extracted from the medical history.
The study was approved by the Assessment, Support and Prevention Unit of the Hospital Clinic of Barcelona and was performed according to the principles of the Declaration of Helsinki and the Good Clinical Practice standards. Written informed consent was obtained from the participants of before their enrollment in the study.
Statistical analysisThe continuous variables are expressed as mean (standard deviation), and the qualitative variables are expressed as frequencies and 95% confidence intervals (95% CI). Parametric variables were compared using Student's t-test for the comparison of 2 independent groups or ANOVA for independent groups. Nonparametric variables were compared using the Mann–Whitney U or Kruskal–Wallis test, depending on the nature of the variables. We used the chi-squared test χ for the qualitative variables.
A multiple logistic regression analysis was performed, with a backwards stepwise correction procedure, using the conditional criterion and using the degree of diabetes control as the dependent variable. To determine the variables associated with good glycemic control (HbA1c <7.0%), we performed a multivariate analysis. The variables considered were age (>70 years/≤70 years), diabetes progression time (>10 years/≤10 years), presence/absence of the combined variable triglycerides >150mg/dL and HDL cholesterol <40mg/dL (in women, <50mg/dL) and abdominal circumference >102cm (in women, >88cm), estimated glomerular filtration rate (eGFR) (<60mL/min/1.73m2/≥60mL/min/1.73m2), presence/absence of insulin treatment, existence/absence of hypoglycemia in the previous year, self-monitoring/no self-monitoring of glycemia and increase/no increase of weight in the previous year. The significance threshold adopted for all tests was 0.05 (bilateral). The statistical analysis was performed with the SAS statistical package (version 9.3).
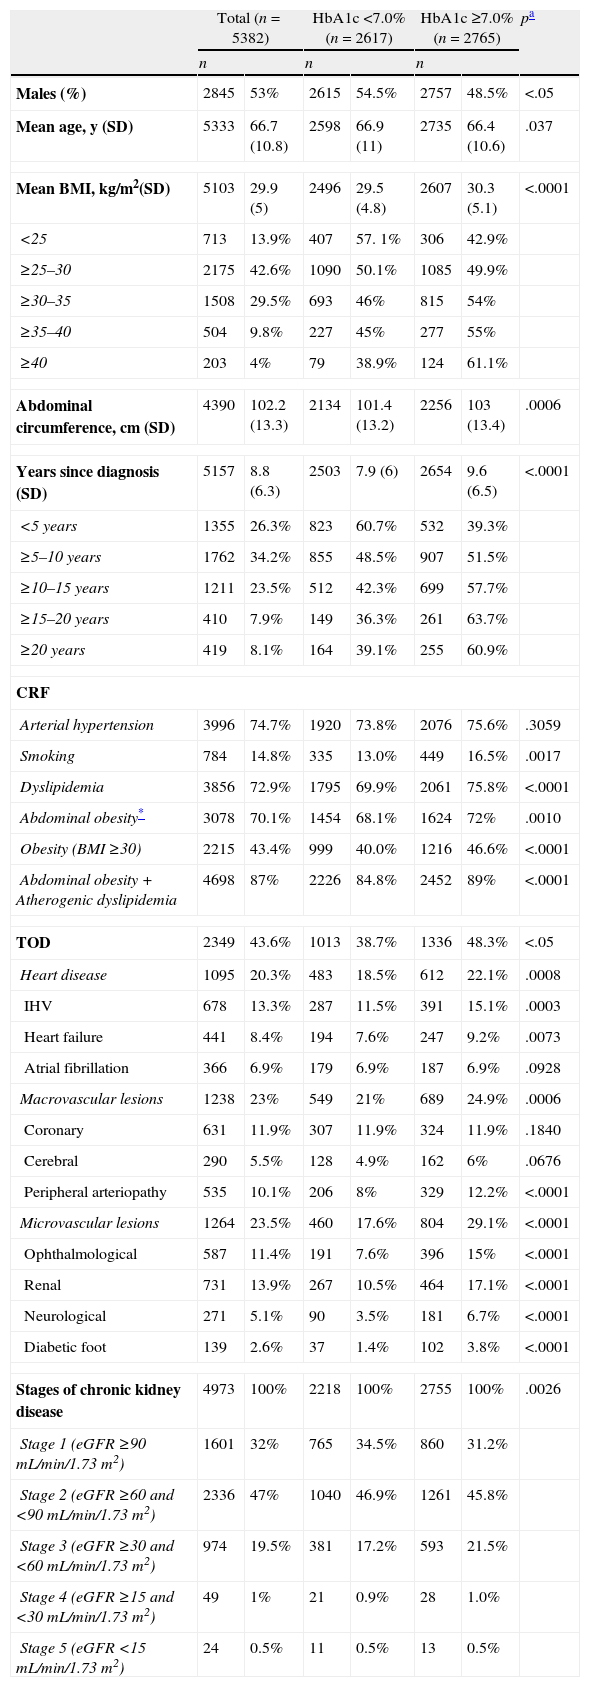
ResultsA total of 5591 patients were enrolled, 209 of whom (3.7%) were excluded for meeting exclusion criteria. Thus, a total of 5382 patients were analyzed, allowing for a precision of 1.35%. The mean HbA1c level determined by the A1cNow+ system was 7.1% (1.1), and 48.6% of the patients (95% CI 47.3–50) had an HbA1c level <7.0%. The main clinical characteristics of the study population and the differences between the patients with HbA1c levels <7.0% and those with HbA1c levels ≥7.0% are summarized in Table 1. The patients with HbA1c levels ≥7.0% had longer lasting diabetes and a higher prevalence of associated processes and delayed complications.
Clinical characteristics of the study population and differences between patients with HbA1c levels <7% and those with HbA1c levels ≥7%.
| Total (n=5382) | HbA1c <7.0% (n=2617) | HbA1c ≥7.0% (n=2765) | pa | ||||
| n | n | n | |||||
| Males (%) | 2845 | 53% | 2615 | 54.5% | 2757 | 48.5% | <.05 |
| Mean age, y (SD) | 5333 | 66.7 (10.8) | 2598 | 66.9 (11) | 2735 | 66.4 (10.6) | .037 |
| Mean BMI, kg/m2(SD) | 5103 | 29.9 (5) | 2496 | 29.5 (4.8) | 2607 | 30.3 (5.1) | <.0001 |
| <25 | 713 | 13.9% | 407 | 57. 1% | 306 | 42.9% | |
| ≥25–30 | 2175 | 42.6% | 1090 | 50.1% | 1085 | 49.9% | |
| ≥30–35 | 1508 | 29.5% | 693 | 46% | 815 | 54% | |
| ≥35–40 | 504 | 9.8% | 227 | 45% | 277 | 55% | |
| ≥40 | 203 | 4% | 79 | 38.9% | 124 | 61.1% | |
| Abdominal circumference, cm (SD) | 4390 | 102.2 (13.3) | 2134 | 101.4 (13.2) | 2256 | 103 (13.4) | .0006 |
| Years since diagnosis (SD) | 5157 | 8.8 (6.3) | 2503 | 7.9 (6) | 2654 | 9.6 (6.5) | <.0001 |
| <5 years | 1355 | 26.3% | 823 | 60.7% | 532 | 39.3% | |
| ≥5–10 years | 1762 | 34.2% | 855 | 48.5% | 907 | 51.5% | |
| ≥10–15 years | 1211 | 23.5% | 512 | 42.3% | 699 | 57.7% | |
| ≥15–20 years | 410 | 7.9% | 149 | 36.3% | 261 | 63.7% | |
| ≥20 years | 419 | 8.1% | 164 | 39.1% | 255 | 60.9% | |
| CRF | |||||||
| Arterial hypertension | 3996 | 74.7% | 1920 | 73.8% | 2076 | 75.6% | .3059 |
| Smoking | 784 | 14.8% | 335 | 13.0% | 449 | 16.5% | .0017 |
| Dyslipidemia | 3856 | 72.9% | 1795 | 69.9% | 2061 | 75.8% | <.0001 |
| Abdominal obesity* | 3078 | 70.1% | 1454 | 68.1% | 1624 | 72% | .0010 |
| Obesity (BMI ≥30) | 2215 | 43.4% | 999 | 40.0% | 1216 | 46.6% | <.0001 |
| Abdominal obesity+Atherogenic dyslipidemia | 4698 | 87% | 2226 | 84.8% | 2452 | 89% | <.0001 |
| TOD | 2349 | 43.6% | 1013 | 38.7% | 1336 | 48.3% | <.05 |
| Heart disease | 1095 | 20.3% | 483 | 18.5% | 612 | 22.1% | .0008 |
| IHV | 678 | 13.3% | 287 | 11.5% | 391 | 15.1% | .0003 |
| Heart failure | 441 | 8.4% | 194 | 7.6% | 247 | 9.2% | .0073 |
| Atrial fibrillation | 366 | 6.9% | 179 | 6.9% | 187 | 6.9% | .0928 |
| Macrovascular lesions | 1238 | 23% | 549 | 21% | 689 | 24.9% | .0006 |
| Coronary | 631 | 11.9% | 307 | 11.9% | 324 | 11.9% | .1840 |
| Cerebral | 290 | 5.5% | 128 | 4.9% | 162 | 6% | .0676 |
| Peripheral arteriopathy | 535 | 10.1% | 206 | 8% | 329 | 12.2% | <.0001 |
| Microvascular lesions | 1264 | 23.5% | 460 | 17.6% | 804 | 29.1% | <.0001 |
| Ophthalmological | 587 | 11.4% | 191 | 7.6% | 396 | 15% | <.0001 |
| Renal | 731 | 13.9% | 267 | 10.5% | 464 | 17.1% | <.0001 |
| Neurological | 271 | 5.1% | 90 | 3.5% | 181 | 6.7% | <.0001 |
| Diabetic foot | 139 | 2.6% | 37 | 1.4% | 102 | 3.8% | <.0001 |
| Stages of chronic kidney disease | 4973 | 100% | 2218 | 100% | 2755 | 100% | .0026 |
| Stage 1 (eGFR ≥90mL/min/1.73m2) | 1601 | 32% | 765 | 34.5% | 860 | 31.2% | |
| Stage 2 (eGFR ≥60 and <90mL/min/1.73m2) | 2336 | 47% | 1040 | 46.9% | 1261 | 45.8% | |
| Stage 3 (eGFR ≥30 and <60mL/min/1.73m2) | 974 | 19.5% | 381 | 17.2% | 593 | 21.5% | |
| Stage 4 (eGFR ≥15 and <30mL/min/1.73m2) | 49 | 1% | 21 | 0.9% | 28 | 1.0% | |
| Stage 5 (eGFR <15mL/min/1.73m2) | 24 | 0.5% | 11 | 0.5% | 13 | 0.5% | |
Abbreviations: BMI, body mass index; CRF, cardiovascular risk factors; eGFR, estimated glomerular filtration rate; TOD, target organ damage; LVH, left ventricular hypertrophy; SD, standard deviation.
Dyslipidemia: Diagnosed dyslipidemia or undergoing lipid-lowering treatment. Arterial hypertension: Diagnosed hypertension or undergoing treatment for hypertension.
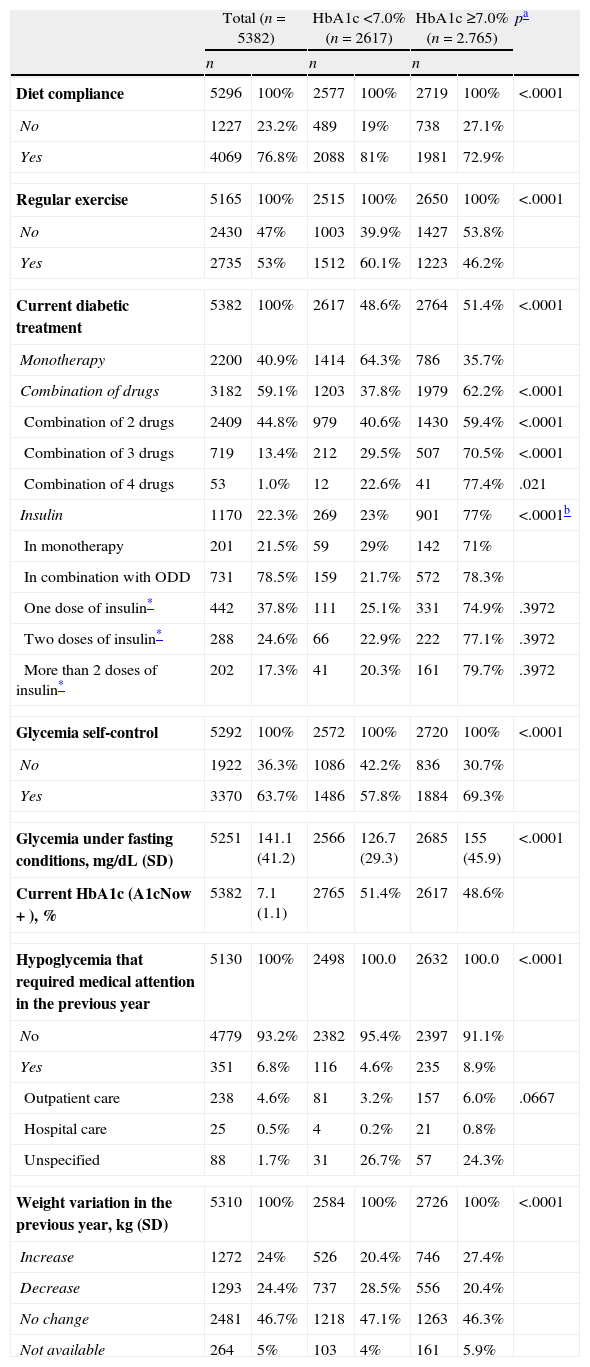
Table 2 shows the hyperglycemia treatment for the patients in the study visit, the glycemic control parameters, the weight changes and the hypoglycemia that required medical attention in the previous year. Some 59.1% of the patients were treated with antidiabetic therapy with 2 or more drugs, and 22.3% were treated with insulin (Table 2). The patients with HbA1c levels ≥7.0% were treated with more complex hypoglycemic therapy and self-controlled their glycemia more frequently, while compliance with the diet and the practice of regular exercise were more frequent in the patient group with HbA1c levels <7.0%. The proportion of patients with HbA1c levels <7.0% was lower (Table 2, Fig. 1) in the patients treated with a combination of hypoglycemic drugs and insulin, especially in those treated with 3 or more drugs and with ≥2 doses of insulin. The increase in weight in the previous year was more frequent and higher in the group with HbA1c levels >7.0% (3.7±2.9kg vs. 3.1±2.4kg; p<.001), while the reduction in weight was more frequent and more intense in the group with HbA1c levels <7.0% (4.5±4 vs. 3.7±3.3kg; p=.0014). The proportion of patients with hypoglycemia who required medical care the year before the visit was significantly higher in the patients with HbA1c levels ≥7.0%.
Hyperglycemia treatment, glycemic control, hypoglycemia and weight changes in the previous year in the study population. Differences between patients with HbA1c levels <7% and those with HbA1c levels ≥7%.
| Total (n=5382) | HbA1c <7.0% (n=2617) | HbA1c ≥7.0% (n=2.765) | pa | ||||
| n | n | n | |||||
| Diet compliance | 5296 | 100% | 2577 | 100% | 2719 | 100% | <.0001 |
| No | 1227 | 23.2% | 489 | 19% | 738 | 27.1% | |
| Yes | 4069 | 76.8% | 2088 | 81% | 1981 | 72.9% | |
| Regular exercise | 5165 | 100% | 2515 | 100% | 2650 | 100% | <.0001 |
| No | 2430 | 47% | 1003 | 39.9% | 1427 | 53.8% | |
| Yes | 2735 | 53% | 1512 | 60.1% | 1223 | 46.2% | |
| Current diabetic treatment | 5382 | 100% | 2617 | 48.6% | 2764 | 51.4% | <.0001 |
| Monotherapy | 2200 | 40.9% | 1414 | 64.3% | 786 | 35.7% | |
| Combination of drugs | 3182 | 59.1% | 1203 | 37.8% | 1979 | 62.2% | <.0001 |
| Combination of 2 drugs | 2409 | 44.8% | 979 | 40.6% | 1430 | 59.4% | <.0001 |
| Combination of 3 drugs | 719 | 13.4% | 212 | 29.5% | 507 | 70.5% | <.0001 |
| Combination of 4 drugs | 53 | 1.0% | 12 | 22.6% | 41 | 77.4% | .021 |
| Insulin | 1170 | 22.3% | 269 | 23% | 901 | 77% | <.0001b |
| In monotherapy | 201 | 21.5% | 59 | 29% | 142 | 71% | |
| In combination with ODD | 731 | 78.5% | 159 | 21.7% | 572 | 78.3% | |
| One dose of insulin* | 442 | 37.8% | 111 | 25.1% | 331 | 74.9% | .3972 |
| Two doses of insulin* | 288 | 24.6% | 66 | 22.9% | 222 | 77.1% | .3972 |
| More than 2 doses of insulin* | 202 | 17.3% | 41 | 20.3% | 161 | 79.7% | .3972 |
| Glycemia self-control | 5292 | 100% | 2572 | 100% | 2720 | 100% | <.0001 |
| No | 1922 | 36.3% | 1086 | 42.2% | 836 | 30.7% | |
| Yes | 3370 | 63.7% | 1486 | 57.8% | 1884 | 69.3% | |
| Glycemia under fasting conditions, mg/dL (SD) | 5251 | 141.1 (41.2) | 2566 | 126.7 (29.3) | 2685 | 155 (45.9) | <.0001 |
| Current HbA1c (A1cNow+), % | 5382 | 7.1 (1.1) | 2765 | 51.4% | 2617 | 48.6% | |
| Hypoglycemia that required medical attention in the previous year | 5130 | 100% | 2498 | 100.0 | 2632 | 100.0 | <.0001 |
| No | 4779 | 93.2% | 2382 | 95.4% | 2397 | 91.1% | |
| Yes | 351 | 6.8% | 116 | 4.6% | 235 | 8.9% | |
| Outpatient care | 238 | 4.6% | 81 | 3.2% | 157 | 6.0% | .0667 |
| Hospital care | 25 | 0.5% | 4 | 0.2% | 21 | 0.8% | |
| Unspecified | 88 | 1.7% | 31 | 26.7% | 57 | 24.3% | |
| Weight variation in the previous year, kg (SD) | 5310 | 100% | 2584 | 100% | 2726 | 100% | <.0001 |
| Increase | 1272 | 24% | 526 | 20.4% | 746 | 27.4% | |
| Decrease | 1293 | 24.4% | 737 | 28.5% | 556 | 20.4% | |
| No change | 2481 | 46.7% | 1218 | 47.1% | 1263 | 46.3% | |
| Not available | 264 | 5% | 103 | 4% | 161 | 5.9% | |
Abbreviations: SD, standard deviation; ODD, Oral diabetes drugs.

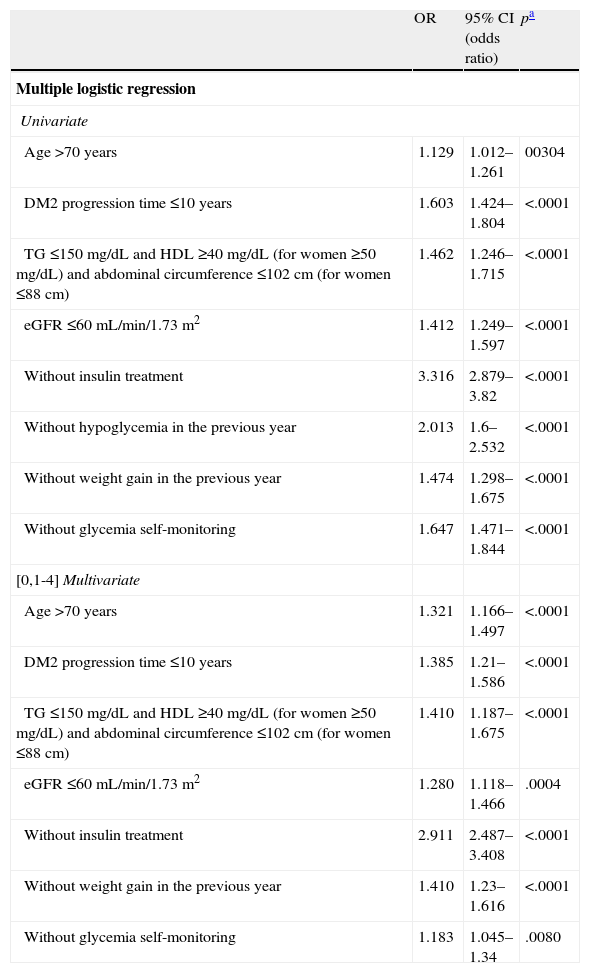
Table 3 shows the results of the logistic regression to determine the factors associated with proper glycemic control. In the univariate analysis, the factors associated most strongly with an HbA1c level <7.0% were the absence of treatment with insulin and hypoglycemia episodes in the previous year. The probability of presenting HbA1c levels <7.0% in the patients without insulin treatment was 3.32 times greater than that in the patients who were treated with insulin (95% CI: 2.879–3.82) and 2.0 times greater in the patients without hypoglycemia in the previous year (95% CI: 1.6–2.532). Other factors associated with good control were age >70years, a diabetes progression time ≤10years, the absence of abdominal obesity and atherogenic dyslipidemia (triglyceride levels ≤150mg/dL and HDL levels ≥40mg/dL [≥50mg/dL in women] and waist circumference ≤102cm [≤88cm in women]), an eGFR ≥60mL/min/1.73m2 and the nonself-monitoring of capillary glycemia. In the multivariate analysis, the factors associated with good control were the same except for the absence of hypoglycemia.
Factors associated with an HbA1c value <7% in the logistic regression analysis.
| OR | 95% CI (odds ratio) | pa | |
| Multiple logistic regression | |||
| Univariate | |||
| Age >70 years | 1.129 | 1.012–1.261 | 00304 |
| DM2 progression time ≤10 years | 1.603 | 1.424–1.804 | <.0001 |
| TG ≤150mg/dL and HDL ≥40mg/dL (for women ≥50mg/dL) and abdominal circumference ≤102cm (for women ≤88cm) | 1.462 | 1.246–1.715 | <.0001 |
| eGFR ≤60mL/min/1.73m2 | 1.412 | 1.249–1.597 | <.0001 |
| Without insulin treatment | 3.316 | 2.879–3.82 | <.0001 |
| Without hypoglycemia in the previous year | 2.013 | 1.6–2.532 | <.0001 |
| Without weight gain in the previous year | 1.474 | 1.298–1.675 | <.0001 |
| Without glycemia self-monitoring | 1.647 | 1.471–1.844 | <.0001 |
| [0,1-4]Multivariate | |||
| Age>70 years | 1.321 | 1.166–1.497 | <.0001 |
| DM2 progression time ≤10 years | 1.385 | 1.21–1.586 | <.0001 |
| TG ≤150mg/dL and HDL ≥40mg/dL (for women ≥50mg/dL) and abdominal circumference ≤102cm (for women ≤88cm) | 1.410 | 1.187–1.675 | <.0001 |
| eGFR ≤60mL/min/1.73m2 | 1.280 | 1.118–1.466 | .0004 |
| Without insulin treatment | 2.911 | 2.487–3.408 | <.0001 |
| Without weight gain in the previous year | 1.410 | 1.23–1.616 | <.0001 |
| Without glycemia self-monitoring | 1.183 | 1.045–1.34 | .0080 |
Abbreviations: DM2, type 2 diabetes mellitus; eGFR, estimated glomerular filtration rate; HDL, high-density lipoprotein cholesterol; TG, triglycerides.
This study, conducted under standard clinical practice conditions in primary care centers in Spain, confirmed the difficulty in achieving the objective of HbA1c levels <7%10–13 in many patients with DM2 treated with hypoglycemic drugs and the deterioration of control as the complexity of the diabetes increases.6–8,14–20 There are numerous causes, which, as shown in this study, include factors related to the pathophysiology of the disease, the coexistence of associated processes and complications and the complexity and adverse effects of treatment.
In this study, the patients with HbA1c levels >7.0% had a higher prevalence of CRF and TOD; however, an age >70years was associated with good glycemic control, which calls into question a lesser degree of intervention in patients at greater risk. As expected,8,19,21–24 the progression time and the proportion of patients with abdominal obesity and/or atherogenic dyslipidemia were greater in the patients with poorer control.8,19,21,22 In the logistic regression analysis, a progression time <10years and the absence of abdominal obesity and atherogenic dyslipidemia were predictors of proper control. These findings are probably related to insulin secretion impairment over time and to the fact that insulin resistance underlies as the relevant pathophysiological element.4,21,23–25
As with previous studies,8,16,18,26 the patients with poor glycemic control self-controlled their glycemia more and were treated with therapies that more often used insulin and combinations of 3 or more drugs, which suggests an attempt to adapt the treatment to the patient's needs. However, therapeutic inertia appears to play a relevant role in the lack of response to the disease progression,27,28 especially in patients treated with insulin.8,19 It is therefore surprising that (1) only 22.3% of the patients were treated with insulin, (2) the proportion of patients with HbA1c levels <7.0% was lower in those treated with insulin and (3) the absence of insulin treatment was the factor most strongly associated with HbA1c levels <7.0%. This fact is also accentuated in the patients treated with 2 or more doses of insulin, which probably reflects the resistance to the use of more physiological and effective insulin regimens in patients with pronounced insulinopenia.29–31
Hypoglycemia and weight gain are significant barriers for optimal control in the patients with DM2.32–36 To our knowledge, however, the relationship between a history of hypoglycemia and weight gain on one hand and glycemic control on the other has not been studied. In this study, the patients with poor glycemic control had a greater probability of increasing body weight and experiencing a hypoglycemic episode that required medical attention in the previous year. In the logistic regression analysis, the absence of these adverse effects was associated with good control. The close relationship between the risk of hypoglycemia and insulin therapy37,38 justifies removing the relationship from the multivariate analysis. Therefore, it is important to take measures to reduce the risk of hypoglycemia and weight gain.
The fundamental limitations of the present study are its observational character, which precludes establishing casual relationships, and its cross-sectional nature and lack of sample randomization. However, this latter limitation we consider minimized due to the considerable sample size and the correlation with other available data in the literature.
In conclusion, the present study confirms the deterioration of control as the complexity of the disease and treatment increases and that a history of hypoglycemia and weight gain are associated with poorer control. This information could be useful for developing strategies, including the selection of therapeutic measures that enable the intensification of treatment in response to the progression of the disease.
FundingThis study was conducted with funding from Almirall Laboratories S.A. (Barcelona, Spain).
Conflicts of interestDr. A. Perex and Dr. J.J. Mediavilla received honoraria from Almirall S.A. for the coordination of the study. DGS is an employee of Almirall.
The authors would like to thank all the physicians who participated in the study, but unfortunately the list is too long to include here. We would also like to thank Almirall, S.A. for their support in funding the study and Adknoma Health Research for their support with logistical management and the statistical study. We would also like to thank Content Ed Net Madrid for their collaboration in the drafting and submission of the manuscript.
Please cite this article as: Pérez A, Mediavilla JJ, Miñambres I, González-Segura D. Control glucémico en pacientes con diabetes mellitus tipo 2 en España. Rev Clin Esp. 2014;214:429–436.

