


The incubation period of COVID-19 helps to determine the optimal duration of the quarantine and inform predictive models of incidence curves. Several emerging studies have produced varying results; this systematic review aims to provide a more accurate estimate of the incubation period of COVID-19.
MethodsFor this systematic review, a literature search was conducted using Pubmed, Scopus/EMBASE, and the Cochrane Library databases, covering all observational and experimental studies reporting the incubation period and published from 1 January 2020 to 21 March 2020.We estimated the mean and 95th percentile of the incubation period using meta-analysis, taking into account between-study heterogeneity, and the analysis with moderator variables.
ResultsWe included seven studies (n=792) in the meta-analysis. The heterogeneity (I2 83.0%, p<0.001) was significantly decreased when we included the study quality and the statistical model used as moderator variables (I2 15%). The mean incubation period ranged from 5.6 (95% CI: 5.2–6.0) to 6.7 days (95% CI: 6.0–7.4) according to the statistical model. The 95th percentile was 12.5 days when the mean age of patients was 60 years, increasing 1 day for every 10 years.
ConclusionBased on the published data reporting the incubation period of COVID-19, the mean time between exposure and onset of clinical symptoms depended on the statistical model used, and the 95th percentile depended on the mean age of the patients. It is advisable to record sex and age when collecting data in order to analyze possible differential patterns.
El período de incubación de la COVID-19 ayuda a determinar la duración óptima del período de cuarentena y a crear modelos predictivos de curvas de incidencia. Se han reportado resultados variables en recientes estudios y, por ello, el objetivo de esta revisión sistemática es proporcionar una estimación más precisa del período de incubación de la COVID-19.
MétodosSe realizó una búsqueda bibliográfica en las bases de datos de Pubmed, Scopus/EMBASE y la Cochrane Library, incluyendo todos los estudios observacionales y experimentales que reportaban un período de incubación y que se habían publicado entre el 1 de enero y el 21 de marzo de 2020. Se estimó la media y el percentil 95 del período de incubación mediante metaanálisis, teniendo en cuenta la heterogeneidad entre los estudios y el análisis con variables moderadoras.
ResultadosSe incluyeron siete estudios (n=792) en el metaanálisis. La heterogeneidad (I2 83,0%, p<0,001) disminuyó significativamente cuando se tuvo en cuenta la calidad del estudio y el modelo estadístico utilizado como variables moderadoras (I2 15%). El período medio de incubación oscilaba entre 5,6 (IC 95%: 5,2 a 6,0) y 6,7 días (IC 95%: 6,0 a 7,4), según el modelo estadístico utilizado. El percentil 95 fue de 12,5 días cuando la edad media de los pacientes era de 60 años, aumentando un día por cada 10 años de edad.
ConclusiónSegún los datos publicados sobre el período de incubación de la COVID-19, el tiempo medio entre la exposición y la aparición de los síntomas clínicos depende del modelo estadístico utilizado y el percentil 95, de la edad media de los pacientes. Se recomienda registrar el sexo y la edad en la recogida de los datos para poder analizar los posibles patrones diferenciales.
Coronavirus disease 2019 (COVID-19) is an infectious disease caused by the novel coronavirus, denominated 2019-nCoV or SARS-CoV-2, and first identified in Wuhan, Hubei Province of China, in December 2019.1 Disease presentation ranges from no symptoms (asymptomatic in rare cases) to severe pneumonia and death.2 The virus's impact has been far-ranging and devastating to health and economic systems around the globe.
As of 27 March 2020, a total of 509,164 confirmed cases had been reported worldwide.3 In response to its is highly contagious nature and rapid, person-to-person transmission, the World Health Organization (WHO) officially declared the COVID-19 outbreak a pandemic on 11 March 2020.3
Possible vaccines and specific antiviral medicines are currently being investigated,4 but pending these developments, the most effective measures to prevent and control the outbreak are frequent handwashing, social distancing, and respiratory hygiene, among others.5 However, because of the fast spread of infections, health authorities in places like China, Italy, and Spain have declared a quarantine period for all affected populations.6
Quantifying the length of the incubation period for COVID-19, that is, the time between exposure to the virus and onset of clinical symptoms is a key research question because this information can inform public health control measures for infectious diseases, including the appropriate duration of the quarantine period.7
Recent studies have reported varying estimates. One based on 10 confirmed cases in China reported a mean incubation period of 5.2 days (95% confidence interval [CI] 4.1–7.0) and a 95th percentile (95%tile) of the distribution of 12.5 days (95% CI: 9.2–18.0).8 The mean incubation period in 88 travellers from Wuhan was 6.5 days (95% CI: 5.6–7.9), while the 95%tile was 11.3 days (95% CI: 9.1–15.7).9
Lauer et al.10 analysed publicly available data for 181 confirmed cases from China, estimating a median incubation period of 5.1 days (95% CI: 4.5–5.8) and a 97.5th percentile of the distribution of 11.5 days (95% CI: 8.2–15.6). The 95%tile of the incubation period may indicate how many days it is necessary to extend the quarantine period to ensure the absence of disease among healthy exposed individuals.
Several of these early reports consider the incubation period a symmetric variable and estimate the mean through the midpoint; however, this leads to an overestimation of the incubation period distribution.11 The incubation period can be estimated by parametric distributions such as Gamma, Weibull, or LogNormal distributions.12
For the time being, the WHO assumes that the incubation period for COVID-19 ranges from 1 to 14 days,4 and the European Centre for Disease Prevention and Control (ECDC) considers 5.1 days as a mean period.13 We carried out a systematic review of published research studies with the aim of providing a more accurate estimate of the incubation period of COVID-19.
MethodsThis systematic review and meta-analysis were conducted according to the Preferred Reporting Items for Systematic Review and Meta-Analysis Protocols (PRISMA-P) 2015 statement.14
Search strategy and selection criteriaA literature search was conducted using PubMed, Scopus/EMBASE and the Cochrane Library databases, covering all papers published from 1 January 2020 to 21 March 2020, with no language restrictions. The following search strategy, combining all terms of interest, was used: (coronavirus[Title/Abstract] OR COVID-19[Title/Abstract] OR SARS-CoV-2 [Title/Abstract]) AND incubation[Title/Abstract] AND period[Title/Abstract]. Additionally, we searched for grey literature (governmental and institutional reports or unpublished studies) using the Google search engine.
We included observational and experimental studies reporting the incubation period of COVID-19. Eligible studies had to report the mean incubation period of COVID-19. Studies that duplicated other publications, reviews, editorials, or letters were excluded.
During the selection process, two review authors independently assessed all papers yielded by the search strategy. After screening titles and abstracts to eliminate unrelated studies, we retrieved the full text of all remaining records and checked them against the eligibility criteria. We resolved disagreements through discussion and consulted a third review author if necessary.
Data analysisThe following information was collected from each study: first author, publication date, data origin, sample size, mean age and range, percentage of men in the sample, the statistical model used, mean incubation period with its 95% CI, standard deviation (SD) and interquartile range (IQR), and mean 95%tile and its 95% CI.
Since COVID-19 was first identified in December 2019 and given the current pandemic sweeping the world, there are no experimental studies on the incubation period, yet and many of the existing research studies aimed to provide information on the process of the outbreak. Thus, the quality of the overall study was not assessed, but rather a quality assessment of reported data was performed using an adapted version of the criteria used by Awofisayo-Okuyelu et al.15
The individual studies included in the present meta-analysis were scored according to the following checklist:
- 1.
Source of data: Reported data were based on confirmed medical reports. (1 point)
- 2.
Exposure: The exposure was clearly defined. (1 point)
- 3.
Diagnosis: All cases were microbiologically confirmed. (1 point)
- 4.
Accuracy of measurement: The exposure time was clearly defined. (1 point)
The maximum quality score was 4 points. The studies were categorized in low (1 or 2 points) or high quality (3 or 4 points) according to the score, and those studies whose score was 1 point were excluded from the meta-analysis.
We meta-analysed data for the mean and 95%tile of the incubation period, applying a random-effects model and evaluating between-study variance using the Tau2 and heterogeneity using Dixon's Q test and Higgin's I2 statistic.16 Where no SDs were available, these were estimated using 95% CIs after obtaining the logs, according to the formula:
where T(0.975,n−1) is the value of the student's t distribution, with a tail probability of 97.5% and n−1 degree of freedom.17 The original scale was restored using the exponential function.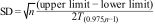
Heterogeneity was assessed using an analysis of the following moderator variables: date of publication, distributional model, mean age, age range, percentage of men, and study quality. Those studies with missing data for some of the moderator variables were excluded from the meta-analysis.
The results of the meta-analysis are displayed as forest plots, showing the first author, date of publication, sample size, type of distributional model, individual effects, and 95% CI, and the overall effect and 95% CI. The plot footnotes show the results of the Q test, its degrees of freedom and the p-value associated with the I2 statistic.
Finally, we assessed the potential reporting bias visually by means of a funnel plot. Analyses were performed using the metaphor Package for the R statistical software, v.4.0.2.
ResultsThe search yielded 40 unique records. After screening titles and abstracts, the full texts of 27 papers were examined: 13 were excluded because they did not report the mean incubation period or were literature reviews. We finally included 14 studies in the review6,8–10,18–27: only 7 of them8–10,18–21 were amenable to meta-analysis since the rest provided neither the 95% CI nor the SD of the incubation period (Fig. 1) or some of the moderator variables were missing. Only 6 of them were included in the meta-analysis of the 95%tile of the incubation period distribution.

Table 1 shows the characteristics of the included studies. Linton et al.18 determined the incubation period in two different samples, so we included their results in the meta-analysis as if they came from two separate studies.
Characteristics of the studies included.
| Author | Publication date | Quality assessment | Origin data | Model | N | Age | % male | Incubation period | 95%tile | |||||
|---|---|---|---|---|---|---|---|---|---|---|---|---|---|---|
| Mean | (range) | Mean | SD | IQR | (95% CI) | Mean | (95% CI) | |||||||
| Li et al.8 | 29 Jan 2020 | 4 High | China | Lognormal | 10 | 59 | (15–89) | 56 | 5.2 | (4.1, 7.0) | 12.5 | (9.2, 18.0) | ||
| Backer et al.9 | 6 Feb 2020 | 3 High | Travellers | Gamma | 88 | 43 | (2–72) | 65 | 6.5 | 2.6 | (5.6, 7.9) | 11.3 | (9.1, 15.7) | |
| Linton et al.18 | 10 Feb 2020 | 3 High | China | Lognormal | 52 | 45a | (30–59) | 58 | 5.0 | 3.0 | (4.2, 6.0) | 10.6 | (8.5, 14.1) | |
| Linton et al.18 | 10 Feb 2020 | 3 High | China | Lognormal | 158 | 45a | (30–59) | 58 | 5.6 | 2.8 | (5.0, 6.3) | 10.8 | (9.3, 12.9) | |
| Tian et al.20 | 27 Feb 2020 | 3 High | China | Unknown | 262 | 47 | (1–94) | 48 | 6.7 | 5.2 | ||||
| Song et al.21 | 1 March 2020 | 2 Low | China | Gamma | 41 | 41 | 5.0 | (4.3, 5.7) | ||||||
| Lauer et al.10 | 10 March 2020 | 2 Low | China | Lognormal | 181 | 44 | (2–80) | 60 | 5.1 | (4.5, 5.8) | 11.5b | (8.2, 15.6) | ||
| Jiang et al.19 | 13 Feb 2020 | 2 Low | China | Unknown | 50 | 4.9 | 2.2 | (4.4, 5.5) | ||||||
| Leung6 | 18 March 2020 | 1 Low | China | Weibull | 175 | 41 | 62 | 7.2 | (6.1, 8.4) | 14.6 | (12.1, 17.1) | |||
| Quian et al.22 | 10 March 2020 | – | China | 91 | 50 | (5–96) | 37 | 6.0 | 3–8 | |||||
| Guan et al.23 | 28 Feb 2020 | – | China | 1099 | 47 | 58 | 4.0 | 2–7 | ||||||
| Ki et al.24 | 9 Feb 2020 | – | S. Korea | 28 | 42 | 54 | 3.9 | |||||||
| Xu et al.25 | 13 Feb 2020 | – | China | 62 | 41 | 56 | 4.0 | 3–5 | ||||||
| Xu et al.26 | 7 March 2020 | – | China | 15 | 35 | 67 | 8.0 | 4–10 | ||||||
| Wu et al.27 | 5 March 2020 | – | China | 40 | 45 | (10–76) | 6.0 | 3–10 | ||||||
SD: standard deviation; IQR: interquartile range; CI: confidence interval; 95%tile: 95th percentile of the incubation period distribution.
The first study was published on 29 January 2020 and the last on 18 March 2020. All of the data collected came from the Chinese provinces affected by COVID-19, except for those reported by Backer et al.,9 who analysed travellers from Wuhan, and the study by Ki et al.,23 performed in South Korea. The study by Li et al.8 obtained the best quality score (4 points), and the study by Leung6 obtained the worst score (1 point) and was excluded from the meta-analysis.
The mean age of the infected people ranged from 35 to 59 years, with a higher incidence in men than in women in most studies. Of the studies presenting data for the SD or the 95% CI, the shortest mean incubation period reported was 4.9 days (Jiang et al.),19 while the longest was 7.2 days (Leung).6 The 95%tile for the incubation period ranged from 10.6 days to 14.6 days.
Altogether, the total sample size for the meta-analysis of the mean incubation period was 792 (Fig. 2: on the left side). The pooled estimate of the mean incubation period was 5.6 days (95% CI: 5.1–6.1). The lowest value reported by any included study was 5.0 days (Linton et al.18 and Song et al.21) and the highest 6.7 days (Tian et al.20). There was considerable between-study heterogeneity (I2 83.0%, p<0.001).

Moderator variables were analysed to identify and eliminate the observed heterogeneity (Table 2). Including the distributional model and quality as a moderator variable led to a significant reduction in heterogeneity (I2) going from 83% to 15%.
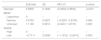
Estimation of days of incubation with moderator variables.
| Estimate | SE | 95% CI | p-value | |
|---|---|---|---|---|
| Intercept | 5.5900 | 0.1840 | (5.2294; 5.9505) | <0.001 |
| Model | ||||
| Lognormal | 0 | – | – | – |
| Gamma | 0.4752 | 0.2527 | (−0.0201; 0.9705) | 0.060 |
| Unknown | 1.1100 | 0.3913 | (0.3431; 1.8770) | 0.005 |
| Quality | ||||
| High | 0 | – | – | – |
| Low | −0.7111 | 0.2399 | (−1.1812; −0.2410) | 0.003 |
Tau2: 0.02; I2: 15%; Q (df=3): 8.8 (p=0.032).
CI: confidence interval; SE: standard error.
The right side of Fig. 2 shows the global estimate of the mean incubation period according to the study quality, and statistical model used. Low-quality studies provided lower estimates of the mean incubation period ranging from 4.9 to 6.0 days. High-quality studies provided estimates of 5.6, 6.1 and 6.7 days, according to Lognormal, Gamma, and Unknown model, respectively.
A total of 489 people contributed data to the analysis of the 95%tile of the incubation period distribution (Fig. 3: on the left side). The pooled estimate showed 11.2 days (95% CI: 10.7–11.8). The lowest, estimate of 10.6 days, was reported by Linton et al.,18 and the highest, of 12.5 days, by Li et al.8 There was considerable heterogeneity (I2 61.7%, p=0.02).

An analysis of moderator variables was also performed including the mean age into the model and the observed heterogeneity was removed, going from 61.7% to 0.0% (Table 3). The global 95%tile of the incubation period varied according to the age of the patients: 10.5, 11.5 and 12.5 days for 40, 50 and 60 years old, respectively. Thus, the 95%tile increased 1 day when age increased 10 years (Fig. 3: on the right side).
DiscussionOur results show that the mean incubation period for COVID-19 is 5.6 days (95% CI: 5.1–6.1) and may vary depending on the model used for its estimation and the study quality. The 95%tile of its distribution is about 11.2 days (10.7–11.8), and it varies according to the mean age of the patients, increasing 1 day per every 10 years.
The WHO is operating under the assumption that the incubation period is from 1 to 14 days,4 while the ECDC13 used Linton et al.’s18 and Li et al.’s8 estimate of a mean period of 5.1 days in a technical report published on 23 March 2020. Our systematic review and meta-analysis considered all data published to date, resulting in an estimate of 5.6 days, or 9.8% longer than the estimate being used by European authorities. Although the magnitude of the difference is not large, it could affect the predictive modelling of the incidence curves that different teams of epidemiological researchers are constructing.28,29
Recent reports have suggested that both the incidence and severity of COVID-19 infections differ according to sex, especially between age groups.10,20,23 These findings also raise the possibility that the distribution of the incubation period could also depend to some extent on sex and age. We were unable to evaluate this possibility in our review, as studies did not disaggregate their data according to patients’ gender.
Our review did find that the estimated mean incubation period can vary depending on the parametric model used and the study quality, as evident from the analysis of moderators (Table 2). This phenomenon should be interpreted with caution, as there could be unmeasured sociodemographic and clinic variables or heterogeneity in the quality of data sources that could explain these differences.
Concerning the 95%tile of the incubation period distribution, our results show that this was about 11.2 days (95% CI: 10.7–11.8), one day longer than Linton et al.’s18 estimate, similar to Backer et al.’s9 results of 11.3 days and Lauer et al.’s10 estimated 97.5%tile of 11.5 days. When we included the mean age of patients as a moderator variable, the 95%tile increased 1 day when the mean age increased 10 years. Therefore, the incubation period depends on the age of the patient.
The 95%tile of the incubation period is an important factor for establishing the correct length of the quarantine,30 especially for healthcare professionals during this global health emergency. The results of the meta-analysis show the upper bound of the 95% CI at 13.6 days for the 95%tile estimate, when the mean age of patients was 60 years old.
Estimating the incubation period entails the inherent difficulty of establishing the exact moment of exposure to the virus among the patients studied. The main limitation of this study was the reliability of the data sources and the heterogeneity of the estimated exposure time points by the included studies. To deal with this limitation the quality of the reported data was assessed, excluding those studies whose quality was low.
Another limitation could be the possible reporting bias observed in the funnel plots (Supplementary Figs. S1 and S2); however, we have included all published studies that met eligibility criteria because we considered this bias is not applicable to these types of descriptive studies with no group comparison.
Another limitation of the present meta-analysis was that data came from patients with symptoms. However, Mizumoto et al.31 estimated that 17.9% of cases are asymptomatic, and thus, our findings cannot be extrapolated to this population.
ConclusionThe mean time from exposure to COVID-19 and the appearance of the first symptoms ranged from 5.6 to 6.7 days according to the statistical model used, including high-quality studies. The 95%tile of the incubation period varied according to the mean age of patients, increasing 1 day when the mean age increased 10 years.
Both the predictive models of incidence curves and the prescribed quarantine periods should take these figures into account. It is advisable to collect data on age and sex when calculating the incubation period in order to analyse potential differences in epidemiological patterns based on these variables.
FundingThis research did not receive any specific grant from funding agencies in the public, commercial, or not-for-profit sectors.
Conflicts of interestThe authors declare that they do not have any conflicts of interest.
We thank Megan Harris for her comments that have greatly improved the manuscript.
The following are the supplementary data to this article:

Please cite this article as: Quesada JA, López-Pineda A, Gil-Guillén VF, Arriero-Marín JM, Gutiérrez F, Carratala-Munuera C. Período de incubación de la COVID-19: revisión sistemática y metaanálisis. Rev Clin Esp. 2021;221:109–117.