
Article information
Full Text
Bibliography
Download PDF
Statistics
Tables (1)
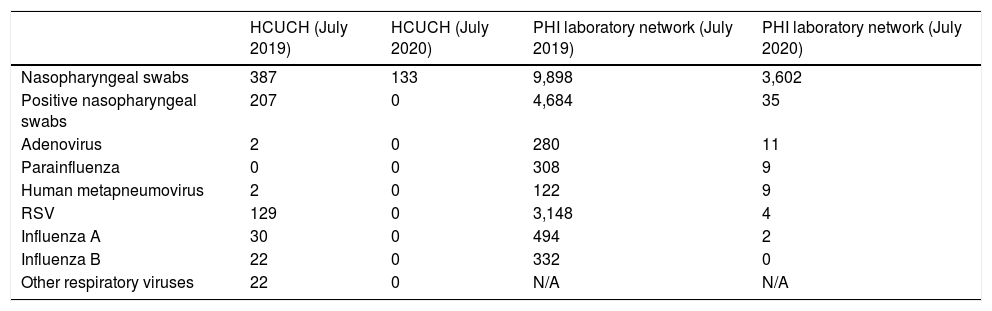
Table 1. Frequency of non-SARS-CoV-2 respiratory viruses diagnosed via molecular biology in the HCUCH compared to the national frequency in the national respiratory virus reference center, PHI (July 2019 and July 2020).
Article
These are the options to access the full texts of the publication Revista Clínica Española (English Edition)
Member
Si es usted socio de FESEMI siga los siguientes pasos:
Diríjase desde aquí a la web de la >>>FESEMI<<< e inicie sesión mediante el formulario que se encuentra en la barra superior, pulsando sobre el candado.
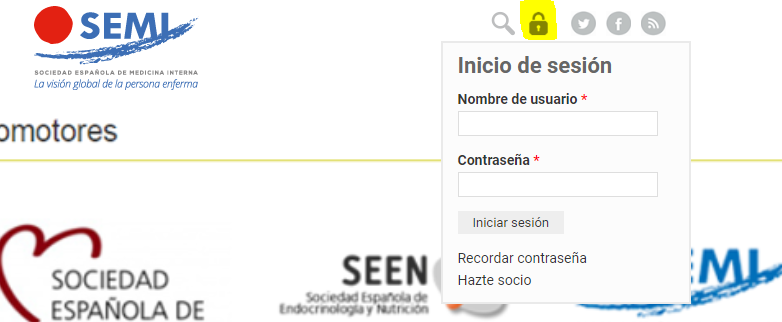
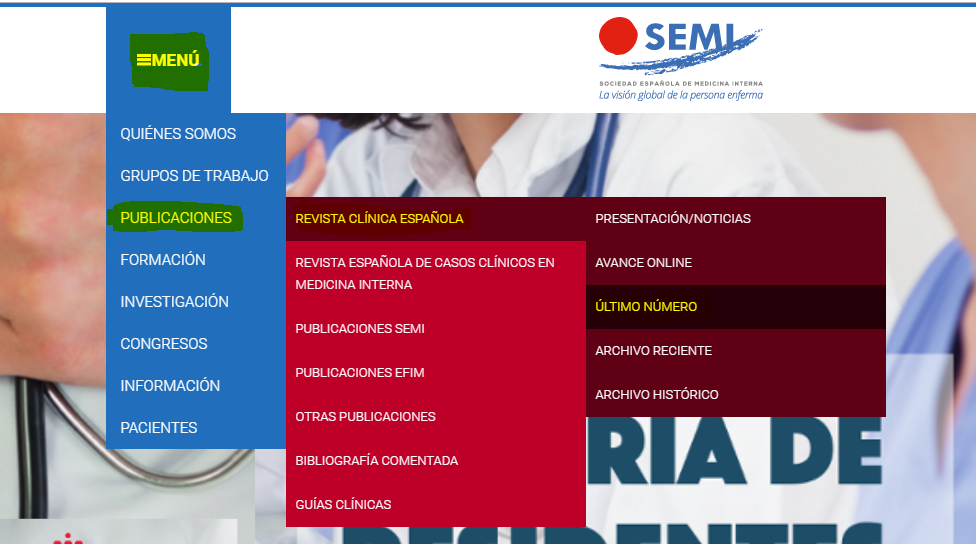
Una vez autentificado, en la misma web de FESEMI, en el menú superior, elija la opción deseada.
>>>FESEMI<<<

Purchase

