
To compare the efficacy and safety of sodUIm-glucose co-transporter-2 (SGLT2) inhibitors and metformin in adults with type 1 diabetes mellitus (T1DM).
MethodsRandomized clinical trials until February 2019, designed to assess the efficacy and safety of SGLT2 inhibitors/metformin in adults with T1DM, were searched on PubMed, EMBASE, the Cochrane Library, and Web of Science. Safety and efficacy data were synthesized using Bayesian network meta-analyses.
ResultsTwenty eligible studies with 5868 participants were included in network meta-analysis. SGLT2 inhibitors provided greater reductions in HbA1c than placebo [weighted mean difference (WMD) −0.40 (95 % confidence interval (CI) −0.47, −0.32)] and metformin (WMD: −0.32; 95 % CI: −0.47, −0.14). Both SGLT2 inhibitors and metformin promoted greater reductions in body weight than placebo. SGLT2 inhibitors caused greater reductions in body weight than metformin (WMD: −1.54; 95 % CI: −2.93, −0.09). Both SGLT2 inhibitors and metformin provided greater reductions in total insulin dose than placebo, while no difference between metformin and SGLT2 inhibitors was found. No difference in severe hypoglycemia was found between SGLT2 inhibitors and metformin. SGLT2 inhibitors induced a higher risk for diabetic ketoacidosis (DKA) than metformin/placebo.
ConclusionSGLT2 inhibitors provided greater reductions in HbA1c and body weight than metformin/placebo. Both SGLT2 inhibitors and metformin induced greater reductions in total insulin dosage than placebo, with no significant differences observed between SGLT2 inhibitors and metformin. SGLT2 inhibitors induced a higher risk for DKA than metformin/placebo.
Comparar la eficacia y la seguridad de los inhibidores del cotransportador-2 de sodio-glucosa (SGLT2) y de la metformina en adultos con diabetes mellitus tipo 1 (DMT1).
MétodosSe buscaron en PubMed, EMBASE, la Cochrane Library y la Web of Science, los ensayos clínicos aleatorizados llevados a cabo hasta febrero de 2019 diseñados para evaluar la eficacia y la seguridad de los inhibidores del SGLT2/metformina en adultos con DMT1. Los datos de seguridad y eficacia fueron recopilados empleando el metanálisis en red bayesiana.
ResultadosVeinte estudios, con 5.868 participantes, fueron aptos para ser incluidos en el metanálisis en red. Los inhibidores del SGLT2 proporcionaron mayores reducciones en la HbA1c que el placebo {diferencia de media ponderada (DMP) −0,40 [intervalo de confianza (IC) de 95 %: −0,47, −0,32]}, y la metformina (DMP: −0,32: IC 95 %: −0,47; −0,14). Tanto los inhibidores del SGLT2 como la metformina favorecieron mayores disminuciones de peso corporal que el placebo (DMP: −1,54; IC 95 %: −2,93; −0,09). Los inhibidores del SGLT2 produjeron mayores disminuciones de peso corporal que la metformina (DMP: −1,54; IC 95 %: −2,93; −0,09). Los inhibidores del SGLT2 y la metformina dieron lugar a mayores reducciones de la dosis total de insulina que el placebo, no encontrándose diferencias entre la metformina y los inhibidores del SGLT2. En cuanto a la hipoglicemia grave, no se encontraron diferencias entre los inhibidores del SGLT2 y la metformina. Los inhibidores del SGLT2 provocaron un mayor riesgo de cetoacidosis diabética (CAD) que la metformina/placebo.
ConclusiónLos inhibidores del SGLT2 proporcionan mayores reducciones en la HBA1c y de peso corporal que la metformina/placebo. Tanto los inhibidores del SGLT2 como la metformina provocaron mayores disminuciones en la dosificación total de insulina que el placebo, no observándose diferencias significativas entre los inhibidores del SGLT2 y la metformina. Los inhibidores del SGLT2 indujeron un mayor riesgo de CAD que la metformina/placebo.
Article
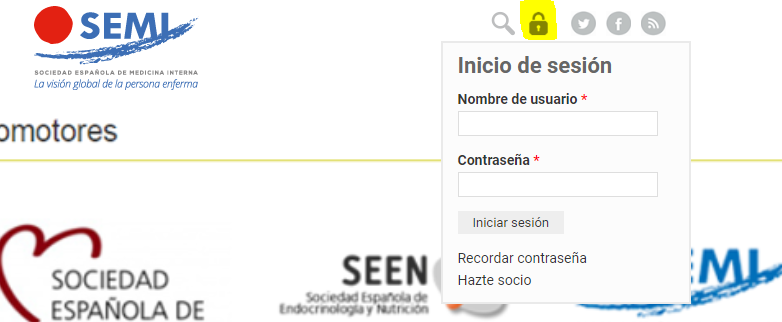
Diríjase desde aquí a la web de la >>>FESEMI<<< e inicie sesión mediante el formulario que se encuentra en la barra superior, pulsando sobre el candado.
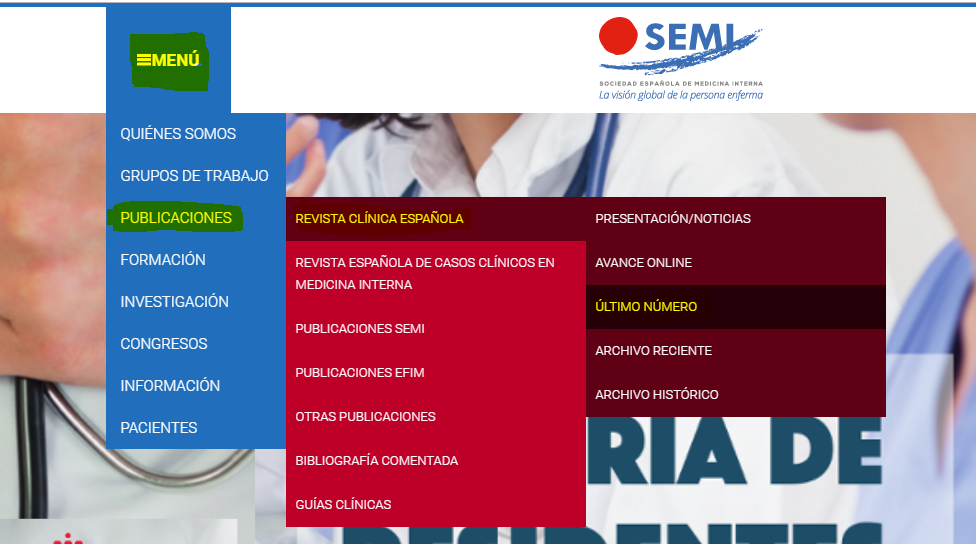
Una vez autentificado, en la misma web de FESEMI, en el menú superior, elija la opción deseada.
>>>FESEMI<<<